407 N Maple St Prospect Heights, IL 60070
Estimated Value: $603,000 - $1,019,000
4
Beds
4
Baths
2,614
Sq Ft
$276/Sq Ft
Est. Value
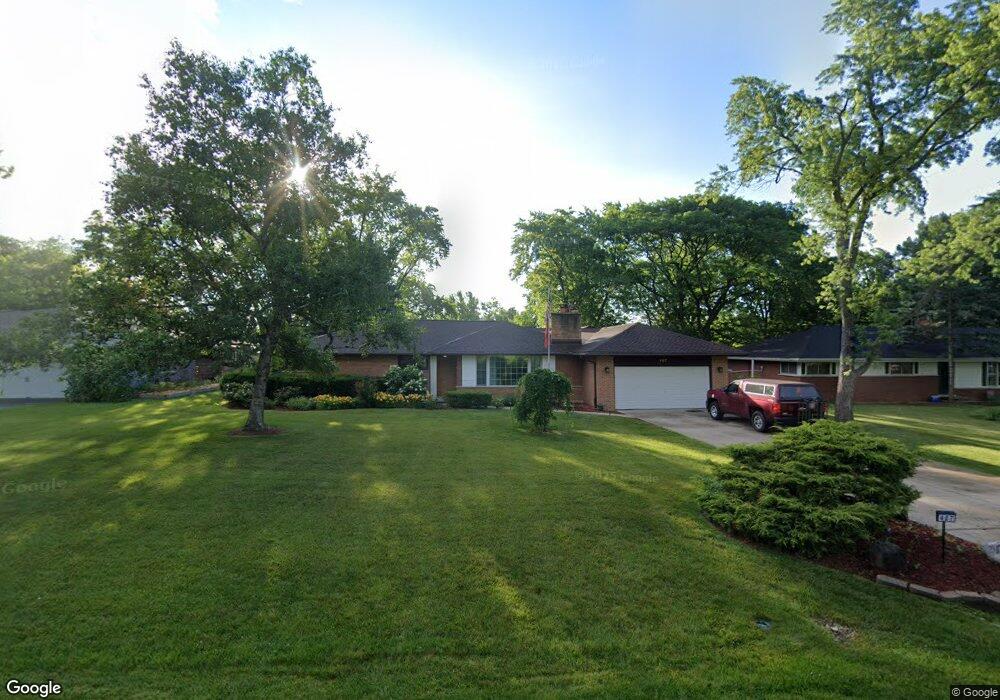
About This Home
This home is located at 407 N Maple St, Prospect Heights, IL 60070 and is currently estimated at $721,720, approximately $276 per square foot. 407 N Maple St is a home located in Cook County with nearby schools including Dwight D Eisenhower Elementary School, Anne Sullivan Elementary School, and Betsy Ross Elementary School.
Ownership History
Date
Name
Owned For
Owner Type
Purchase Details
Closed on
Jun 22, 2009
Sold by
Mckenzie Donald Michael and Mckenzie Donna J
Bought by
Merle Sam and Merle Margaret
Current Estimated Value
Home Financials for this Owner
Home Financials are based on the most recent Mortgage that was taken out on this home.
Original Mortgage
$350,000
Outstanding Balance
$220,063
Interest Rate
4.92%
Mortgage Type
Unknown
Estimated Equity
$501,657
Purchase Details
Closed on
Feb 13, 2008
Sold by
Deduc Mckenzie Donna J
Bought by
Mckenzie Donna J
Home Financials for this Owner
Home Financials are based on the most recent Mortgage that was taken out on this home.
Original Mortgage
$296,500
Interest Rate
5.93%
Mortgage Type
Reverse Mortgage Home Equity Conversion Mortgage
Purchase Details
Closed on
Aug 26, 1997
Sold by
Mckenzie Donald Michael and Mckenzie Donna Jean
Bought by
Deduc Mckenzie Donna J and Donna J Mckenzie Marital Deduction Decla
Create a Home Valuation Report for This Property
The Home Valuation Report is an in-depth analysis detailing your home's value as well as a comparison with similar homes in the area
Home Values in the Area
Average Home Value in this Area
Purchase History
| Date | Buyer | Sale Price | Title Company |
|---|---|---|---|
| Merle Sam | $550,000 | Ticor Title Insurance Co | |
| Mckenzie Donna J | -- | Mgr | |
| Deduc Mckenzie Donna J | -- | -- |
Source: Public Records
Mortgage History
| Date | Status | Borrower | Loan Amount |
|---|---|---|---|
| Open | Merle Sam | $350,000 | |
| Previous Owner | Mckenzie Donna J | $296,500 |
Source: Public Records
Tax History
| Year | Tax Paid | Tax Assessment Tax Assessment Total Assessment is a certain percentage of the fair market value that is determined by local assessors to be the total taxable value of land and additions on the property. | Land | Improvement |
|---|---|---|---|---|
| 2025 | -- | $57,000 | $10,600 | $46,400 |
| 2024 | -- | $44,000 | $8,480 | $35,520 |
| 2023 | -- | $44,000 | $8,480 | $35,520 |
| 2022 | $0 | $44,000 | $8,480 | $35,520 |
| 2021 | $13,111 | $36,310 | $7,420 | $28,890 |
| 2020 | $13,111 | $36,310 | $7,420 | $28,890 |
| 2019 | $0 | $40,616 | $7,420 | $33,196 |
| 2018 | $0 | $42,893 | $6,360 | $36,533 |
| 2017 | $13,111 | $42,893 | $6,360 | $36,533 |
| 2016 | $0 | $42,893 | $6,360 | $36,533 |
| 2015 | $12,027 | $38,281 | $5,300 | $32,981 |
| 2014 | $9,961 | $38,281 | $5,300 | $32,981 |
| 2013 | $9,672 | $38,281 | $5,300 | $32,981 |
Source: Public Records
Map
Nearby Homes
- 214 N Elmhurst Rd
- 13 W Kenilworth Ave
- 206 Elm St
- 802 Andover Ct
- 1525 Sander Ct Unit 113
- 1525 Sander Ct Unit 108
- 1525 Sander Ct Unit 103
- 1550 Sandpebble Dr Unit 209
- 206 E Camp Mcdonald Rd
- 304 E Camp Mcdonald Rd
- 1450 Sandpebble Dr Unit 333
- 1975 Merlot Ct
- 16 Robert Ave
- 105 W Dover Dr Unit T3
- 101 W Brighton Place Unit T9
- 101 N Schoenbeck Rd
- 250 W Parliament Place Unit 301
- 1454 N Elmhurst Rd Unit 102B
- 55 Willow Rd
- 307 Anne Ct
- 409 N Maple St
- 405 N Maple St Unit 1
- 404 Hillcrest Dr
- 403 N Maple St
- 411 N Maple St
- 402 Hillcrest Dr
- 408 N Maple St
- 400 Hillcrest Dr
- 410 N Maple St
- 501 N Maple St
- 408 Hillcrest Dr
- 12 E Willow Rd
- 412 N Maple St
- 402 Hill Ct
- 10 E Willow Rd
- 503 N Maple St
- 500 N Maple St
- 400 Hill Ct
- 8 E Willow Rd
- 309 N Maple St
Your Personal Tour Guide
Ask me questions while you tour the home.