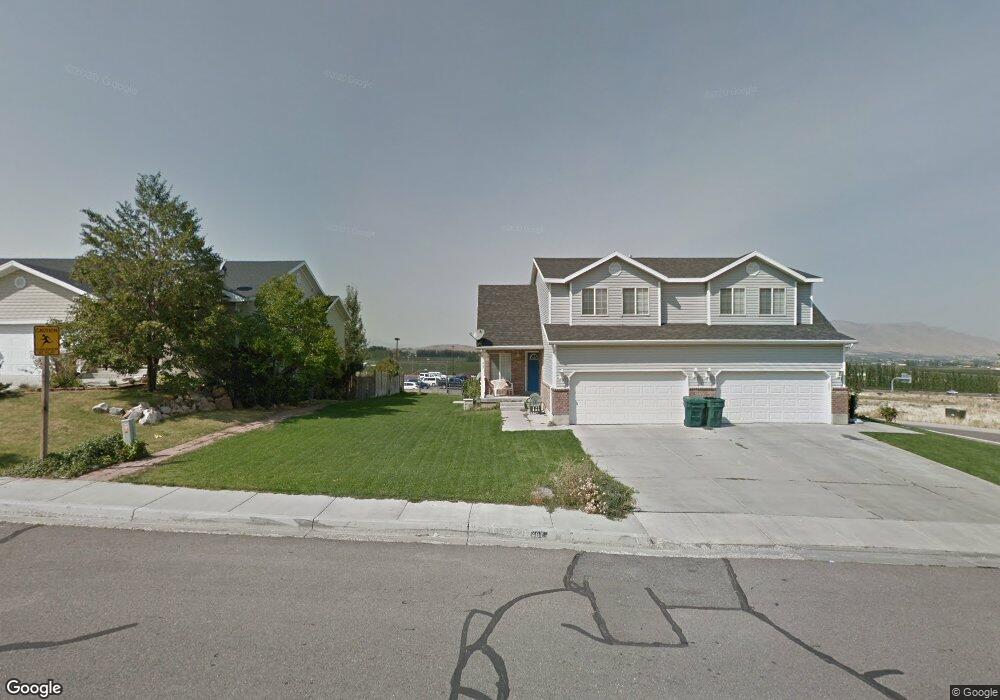
407 N Peach St Santaquin, UT 84655
Estimated Value: $342,000 - $449,000
5
Beds
4
Baths
2,107
Sq Ft
$188/Sq Ft
Est. Value
About This Home
This home is located at 407 N Peach St, Santaquin, UT 84655 and is currently estimated at $395,196, approximately $187 per square foot. 407 N Peach St is a home located in Utah County with nearby schools including Orchard Hills Elementary School, Payson Junior High School, and Payson High School.
Ownership History
Date
Name
Owned For
Owner Type
Purchase Details
Closed on
May 26, 2022
Sold by
Chief Reversion Llc
Bought by
Tintic Consolidated Metals Llc
Current Estimated Value
Purchase Details
Closed on
May 7, 2021
Sold by
Leon Rodrigo A Martinez
Bought by
Leon Rodrigo A Martinez and Martinez Barrera Antonio
Purchase Details
Closed on
Oct 23, 2017
Sold by
Martinez Leon Rodrigo A
Bought by
Maritnez Leon Rodrigo A and Maritnez Barrera Antonio Fidel
Home Financials for this Owner
Home Financials are based on the most recent Mortgage that was taken out on this home.
Original Mortgage
$208,550
Interest Rate
3.78%
Mortgage Type
New Conventional
Purchase Details
Closed on
Oct 18, 2017
Sold by
Langlois David and Langlois Hillary
Bought by
Martinez Leon Rodrigo A
Home Financials for this Owner
Home Financials are based on the most recent Mortgage that was taken out on this home.
Original Mortgage
$208,550
Interest Rate
3.78%
Mortgage Type
New Conventional
Purchase Details
Closed on
Aug 28, 2015
Sold by
Peterson Lindsey
Bought by
Langlois David and Langlois Hillary
Home Financials for this Owner
Home Financials are based on the most recent Mortgage that was taken out on this home.
Original Mortgage
$161,581
Interest Rate
3.91%
Mortgage Type
New Conventional
Purchase Details
Closed on
Oct 4, 2005
Sold by
Johnson Wayne M
Bought by
Peterson Lindsey
Purchase Details
Closed on
Apr 12, 2002
Sold by
Jf Drywall
Bought by
Johnson Wayne M
Purchase Details
Closed on
Nov 2, 2000
Sold by
River Ridge Development Llc
Bought by
Drywall Jf
Home Financials for this Owner
Home Financials are based on the most recent Mortgage that was taken out on this home.
Original Mortgage
$127,703
Interest Rate
7.9%
Mortgage Type
Seller Take Back
Purchase Details
Closed on
Sep 26, 2000
Sold by
River Ridge Development Llc
Bought by
Nelson David W and Watts David
Home Financials for this Owner
Home Financials are based on the most recent Mortgage that was taken out on this home.
Original Mortgage
$127,703
Interest Rate
7.9%
Mortgage Type
Seller Take Back
Create a Home Valuation Report for This Property
The Home Valuation Report is an in-depth analysis detailing your home's value as well as a comparison with similar homes in the area
Home Values in the Area
Average Home Value in this Area
Purchase History
| Date | Buyer | Sale Price | Title Company |
|---|---|---|---|
| Tintic Consolidated Metals Llc | -- | None Listed On Document | |
| Leon Rodrigo A Martinez | -- | Advanced Title | |
| Leon Rodrigo A Martinez | -- | Advanced Title | |
| Maritnez Leon Rodrigo A | -- | Accommodation | |
| Martinez Leon Rodrigo A | -- | Key Land Title | |
| Langlois David | -- | Gt Title Services | |
| Peterson Lindsey | -- | Quality Title | |
| Johnson Wayne M | -- | Mountain West Title Co | |
| Drywall Jf | -- | Inwest Title Services Inc | |
| Nelson David W | -- | Meridian Title |
Source: Public Records
Mortgage History
| Date | Status | Borrower | Loan Amount |
|---|---|---|---|
| Previous Owner | Martinez Leon Rodrigo A | $208,550 | |
| Previous Owner | Langlois David | $161,581 | |
| Previous Owner | Drywall Jf | $127,703 | |
| Previous Owner | Nelson David W | $116,450 |
Source: Public Records
Tax History Compared to Growth
Tax History
| Year | Tax Paid | Tax Assessment Tax Assessment Total Assessment is a certain percentage of the fair market value that is determined by local assessors to be the total taxable value of land and additions on the property. | Land | Improvement |
|---|---|---|---|---|
| 2025 | $3,820 | $391,000 | $67,500 | $323,500 |
| 2024 | $3,820 | $380,400 | $0 | $0 |
| 2023 | $2,105 | $210,265 | $0 | $0 |
| 2022 | $2,041 | $210,265 | $0 | $0 |
| 2021 | $1,756 | $280,500 | $44,000 | $236,500 |
| 2020 | $1,678 | $259,700 | $44,000 | $215,700 |
| 2019 | $1,548 | $245,000 | $44,000 | $201,000 |
| 2018 | $1,294 | $195,300 | $44,000 | $151,300 |
| 2017 | $1,197 | $96,525 | $0 | $0 |
| 2016 | $1,043 | $82,445 | $0 | $0 |
| 2015 | $1,022 | $79,200 | $0 | $0 |
| 2014 | $960 | $74,250 | $0 | $0 |
Source: Public Records
Map
Nearby Homes
- 382 N Peach St
- 78 N Peach St
- 692 E 180 N
- 65 S 940 E
- 12975 Utah 198
- 1134 W Hidden Dr
- 13600 W Chimney Rock Pass S
- 4300 S Highway 198
- 13460 S Highway 6
- 1500 S 5200 W
- 4400 S Highway 198
- 2151 N York Ln Unit 11
- 160 N 300 E
- 348 N 200 E
- 1171 E 430 S
- 345 E 100 St S
- 343 E 100 St S
- 341 E 100 S
- 1143 E 430 S
- 155 E 300 S
- 415 N Peach St
- 403 N Peach St
- 395 N Peach St
- 412 N Peach St
- 404 N Peach St
- 387 N Peach St
- 396 N Peach St
- 388 N Peach St
- 381 N Peach St
- 397 N Cherry Ln Unit 1
- 373 N Peach St
- 374 N Peach St
- 368 N Peach St
- 367 N Peach St
- 357 N Appleview Dr
- 358 N Peach St
- 357 N Peach St
- 357 N Peach St Unit 9
- 1027 E Appleview Dr
- 347 N Appleview Dr