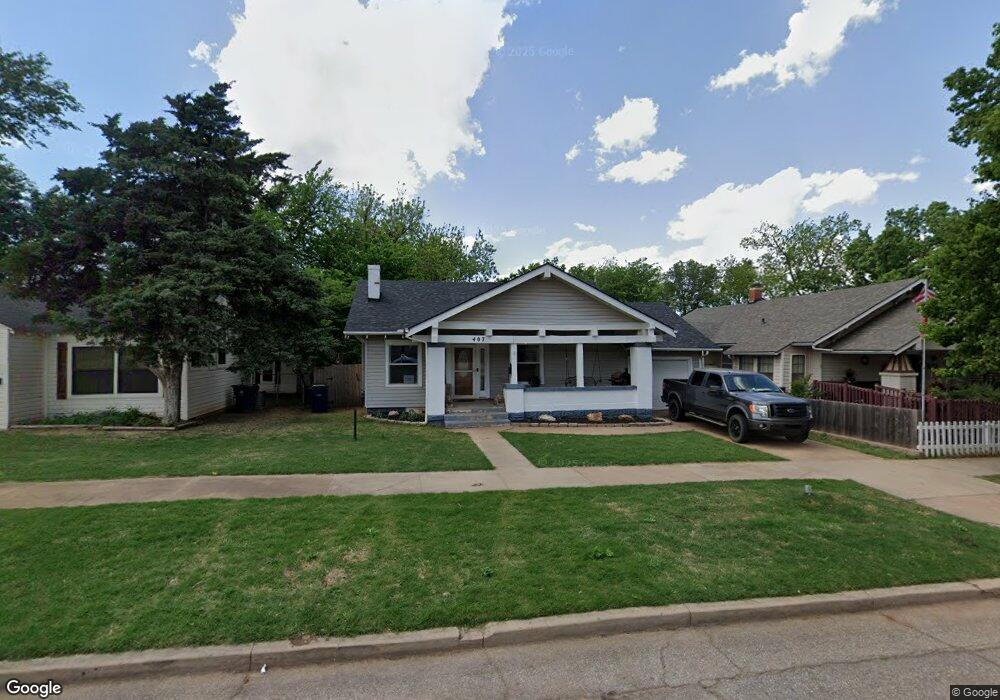
407 N Wentz St Guthrie, OK 73044
Estimated Value: $161,000 - $196,000
--
Bed
--
Bath
1,718
Sq Ft
$102/Sq Ft
Est. Value
About This Home
This home is located at 407 N Wentz St, Guthrie, OK 73044 and is currently estimated at $174,587, approximately $101 per square foot. 407 N Wentz St is a home located in Logan County with nearby schools including Central Elementary School, Fogarty Elementary School, and Cotteral Elementary School.
Ownership History
Date
Name
Owned For
Owner Type
Purchase Details
Closed on
Jun 5, 2017
Sold by
Dean Down
Bought by
Dean Michael
Current Estimated Value
Purchase Details
Closed on
Feb 24, 2014
Sold by
Dean Michael Anthony and Dean Dawn
Bought by
Dean Michael and Dean Dawn
Home Financials for this Owner
Home Financials are based on the most recent Mortgage that was taken out on this home.
Original Mortgage
$89,600
Interest Rate
4.47%
Mortgage Type
New Conventional
Purchase Details
Closed on
Jul 9, 2007
Sold by
Dean Angela Kay and Dean Michael Anthory
Bought by
Dean Michael Anthony
Create a Home Valuation Report for This Property
The Home Valuation Report is an in-depth analysis detailing your home's value as well as a comparison with similar homes in the area
Home Values in the Area
Average Home Value in this Area
Purchase History
| Date | Buyer | Sale Price | Title Company |
|---|---|---|---|
| Dean Michael | -- | None Available | |
| Dean Michael | -- | None Available | |
| Dean Michael Anthony | -- | None Available |
Source: Public Records
Mortgage History
| Date | Status | Borrower | Loan Amount |
|---|---|---|---|
| Closed | Dean Michael | $89,600 |
Source: Public Records
Tax History Compared to Growth
Tax History
| Year | Tax Paid | Tax Assessment Tax Assessment Total Assessment is a certain percentage of the fair market value that is determined by local assessors to be the total taxable value of land and additions on the property. | Land | Improvement |
|---|---|---|---|---|
| 2025 | $975 | $10,182 | $809 | $9,373 |
| 2024 | $1,012 | $10,742 | $809 | $9,933 |
| 2023 | $1,012 | $10,316 | $809 | $9,507 |
| 2022 | $905 | $9,825 | $809 | $9,016 |
| 2021 | $911 | $9,825 | $809 | $9,016 |
| 2020 | $903 | $9,722 | $809 | $8,913 |
| 2019 | $990 | $10,484 | $809 | $9,675 |
| 2018 | $962 | $10,484 | $809 | $9,675 |
| 2017 | $1,015 | $11,247 | $809 | $10,438 |
| 2016 | $1,014 | $11,111 | $760 | $10,351 |
| 2014 | $769 | $10,078 | $380 | $9,698 |
| 2013 | -- | $10,471 | $380 | $10,091 |
Source: Public Records
Map
Nearby Homes
- 124 W Noble Ave
- 514 N 1st St
- 322 E Warner Ave
- 611 N Broad St
- 621 N Wentz St
- 105 E College Ave
- 407 E Washington Ave
- 611 E Noble Ave
- 624 E Noble Ave
- 624 E Mansur Ave
- 316 W Vilas Ave
- 609 E College Ave
- 515 E Harrison Ave
- 403 E Vilas Ave
- 312 S Ash St
- 318 S 2nd St
- 708 E Harrison Ave
- 710 S 2nd St
- 411 W Springer Ave
- 708 E Vilas Ave
- 411 N Wentz St
- 114 E Warner Ave
- 410 N Division St
- 414 N Division St
- 423 N Wentz St
- 420 N Division St
- 414 N Wentz St
- 105 E Warner Ave
- 422 N Division St
- 424 N Wentz St
- 424 N Division St
- 207 E Mansur Ave
- 103 E Warner Ave
- 211 E Mansur Ave
- 314 N Division St
- 501 N Wentz St
- 405 N Division St
- 409 N Division St
- 411 N Division St
- 502 N Division St