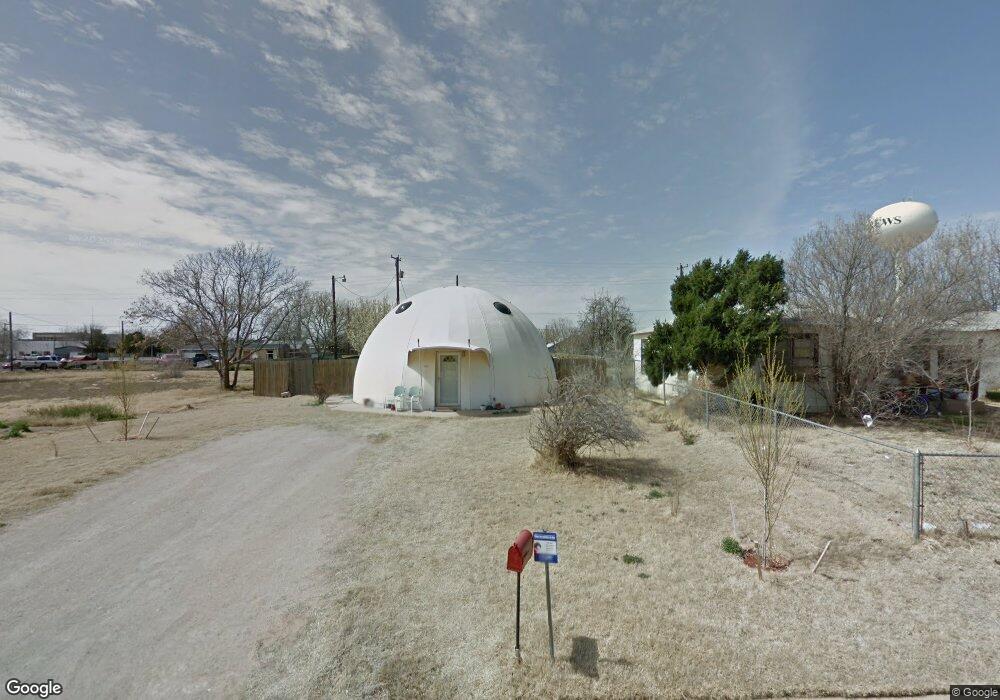
407 NE 2nd St Andrews, TX 79714
Estimated Value: $145,934 - $209,000
--
Bed
--
Bath
1,257
Sq Ft
$143/Sq Ft
Est. Value
About This Home
This home is located at 407 NE 2nd St, Andrews, TX 79714 and is currently estimated at $179,484, approximately $142 per square foot. 407 NE 2nd St is a home located in Andrews County with nearby schools including Clearfork Elementary School, Underwood Elementary School, and Devonian Elementary School.
Ownership History
Date
Name
Owned For
Owner Type
Purchase Details
Closed on
Aug 12, 2008
Bought by
Jaquez Rudy A
Current Estimated Value
Create a Home Valuation Report for This Property
The Home Valuation Report is an in-depth analysis detailing your home's value as well as a comparison with similar homes in the area
Home Values in the Area
Average Home Value in this Area
Purchase History
| Date | Buyer | Sale Price | Title Company |
|---|---|---|---|
| Jaquez Rudy A | -- | -- |
Source: Public Records
Tax History Compared to Growth
Tax History
| Year | Tax Paid | Tax Assessment Tax Assessment Total Assessment is a certain percentage of the fair market value that is determined by local assessors to be the total taxable value of land and additions on the property. | Land | Improvement |
|---|---|---|---|---|
| 2025 | $2,248 | $138,433 | $9,000 | $129,433 |
| 2024 | $2,131 | $131,234 | $9,000 | $122,234 |
| 2023 | $2,050 | $123,154 | $9,000 | $114,154 |
| 2022 | $2,488 | $126,452 | $9,000 | $117,452 |
| 2021 | $2,902 | $124,626 | $9,000 | $115,626 |
| 2020 | $2,298 | $101,039 | $9,000 | $92,039 |
| 2019 | $2,189 | $92,571 | $9,000 | $83,571 |
| 2018 | $2,176 | $91,308 | $9,000 | $82,308 |
| 2017 | $1,027 | $96,546 | $9,000 | $87,546 |
| 2016 | $1,933 | $96,546 | $9,000 | $87,546 |
| 2015 | -- | $91,827 | $9,000 | $82,827 |
| 2014 | -- | $84,740 | $4,380 | $80,360 |
Source: Public Records
Map
Nearby Homes