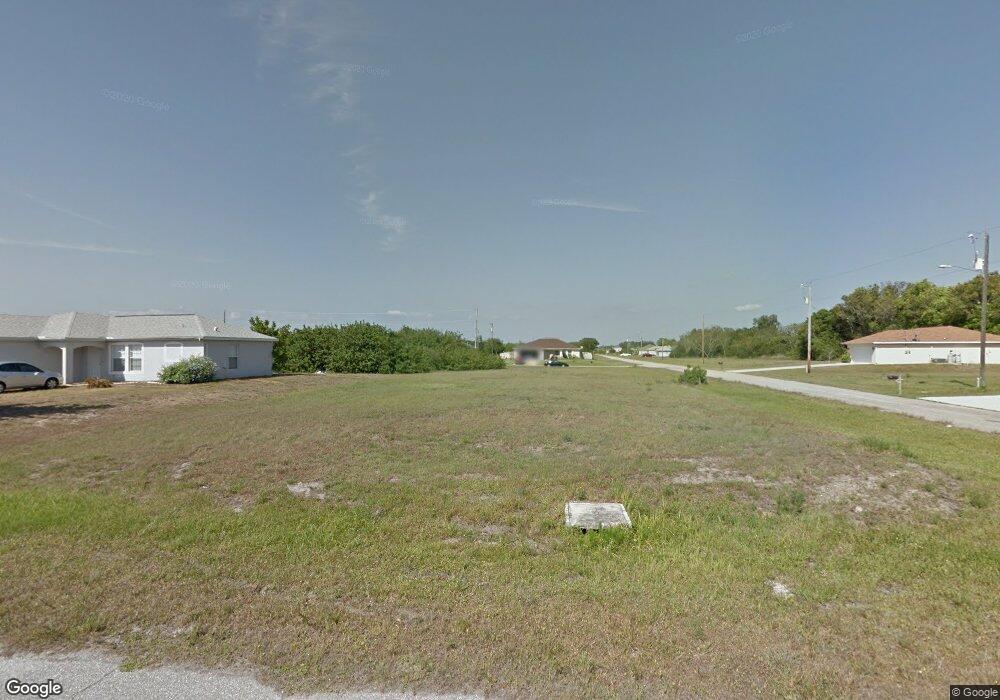
407 NE Juanita Place Cape Coral, FL 33909
Mariner NeighborhoodEstimated Value: $374,308 - $453,000
4
Beds
2
Baths
2,090
Sq Ft
$202/Sq Ft
Est. Value
About This Home
This home is located at 407 NE Juanita Place, Cape Coral, FL 33909 and is currently estimated at $422,077, approximately $201 per square foot. 407 NE Juanita Place is a home with nearby schools including Caloosa Elementary School, Tropic Isles Elementary School, and J. Colin English Elementary School.
Ownership History
Date
Name
Owned For
Owner Type
Purchase Details
Closed on
Nov 18, 2022
Sold by
Dr Horton Inc
Bought by
Vilmeus Cleophat and Vilmeus Gerthie Agenor
Current Estimated Value
Home Financials for this Owner
Home Financials are based on the most recent Mortgage that was taken out on this home.
Original Mortgage
$379,000
Outstanding Balance
$367,248
Interest Rate
6.95%
Mortgage Type
New Conventional
Estimated Equity
$54,829
Purchase Details
Closed on
Nov 18, 2021
Sold by
Dreams To Realty Ii Llc
Bought by
D R Horton Inc
Purchase Details
Closed on
Jul 13, 2021
Sold by
Banco Sherian K
Bought by
Dreams To Realty Ii Llc
Purchase Details
Closed on
Sep 24, 2013
Sold by
Aan Tv Realty Inc
Bought by
Banco Joseph F and Banco Sherian K
Purchase Details
Closed on
Aug 13, 2013
Sold by
County Of Lee
Bought by
Aan Tv Realty Inc
Purchase Details
Closed on
Dec 20, 2002
Sold by
Gamp Leo H
Bought by
Gamp Leo H
Create a Home Valuation Report for This Property
The Home Valuation Report is an in-depth analysis detailing your home's value as well as a comparison with similar homes in the area
Home Values in the Area
Average Home Value in this Area
Purchase History
| Date | Buyer | Sale Price | Title Company |
|---|---|---|---|
| Vilmeus Cleophat | $400,000 | Dhi Title Of Florida | |
| D R Horton Inc | $34,990 | Dhi Title Of Florida | |
| Dreams To Realty Ii Llc | $60,000 | Old Florida Title | |
| Banco Joseph F | $11,600 | None Available | |
| Aan Tv Realty Inc | $5,918 | None Available | |
| Gamp Leo H | -- | -- |
Source: Public Records
Mortgage History
| Date | Status | Borrower | Loan Amount |
|---|---|---|---|
| Open | Vilmeus Cleophat | $379,000 |
Source: Public Records
Tax History Compared to Growth
Tax History
| Year | Tax Paid | Tax Assessment Tax Assessment Total Assessment is a certain percentage of the fair market value that is determined by local assessors to be the total taxable value of land and additions on the property. | Land | Improvement |
|---|---|---|---|---|
| 2025 | $5,116 | $319,497 | -- | -- |
| 2024 | $5,116 | $310,493 | $42,874 | $267,619 |
| 2023 | $5,467 | $333,451 | $40,425 | $289,979 |
| 2022 | $801 | $24,937 | $24,937 | $0 |
| 2021 | $2,746 | $11,000 | $11,000 | $0 |
| 2020 | $2,938 | $7,800 | $7,800 | $0 |
| 2019 | $2,965 | $13,000 | $13,000 | $0 |
| 2018 | $2,941 | $11,000 | $11,000 | $0 |
| 2017 | $438 | $10,740 | $10,740 | $0 |
| 2016 | $385 | $7,000 | $7,000 | $0 |
| 2015 | $352 | $6,500 | $6,500 | $0 |
| 2014 | $289 | $5,640 | $5,640 | $0 |
| 2013 | -- | $4,200 | $4,200 | $0 |
Source: Public Records
Map
Nearby Homes
- 435 NE 1st Ave
- 365 Santa Barbara Blvd N
- 439 NE Juanita Ct
- 142 NE 4th St Unit 35
- 1435 NE Juanita Place
- 454 NE Juanita Ct
- 512 NE Juanita Place
- 469 NE Juanita Place
- 405 NW Juanita Ct
- 458 NE Juanita Ct
- 475 NE 2nd Place
- 476 NE 3rd Ave
- 479 NE 2nd Place
- 35 NE 5th Terrace
- 322 NE 4th St
- 0 48' Boat Slip at Gulf Harbour G-1 Unit 1
- 104 NE 6th St
- 511 NW Juanita Ct
- 141 Hancock Bridge Pkwy W
- 324 NW 1st Place
- 411 NE Juanita Place
- 412 NE Juanita Ct
- 34 NE 4th St
- 415 NE Juanita Place
- 38 NE 4th St
- 420 NE Juanita Ct
- 42 NE 4th St
- 416 NE Juanita Ct
- 46 NE 4th St
- 415 NE Juanita Ct
- 419 NE Juanita Ct
- 423 NE Juanita Place
- 428 NE Juanita Ct
- 423 NE Juanita Ct
- 427 NE Juanita Ct
- 54 NE 4th St
- 420 NE 1st Ave
- 432 NE Juanita Ct
- 420 NE 1st Ave Cape Cora
- 429 NE Juanita Place