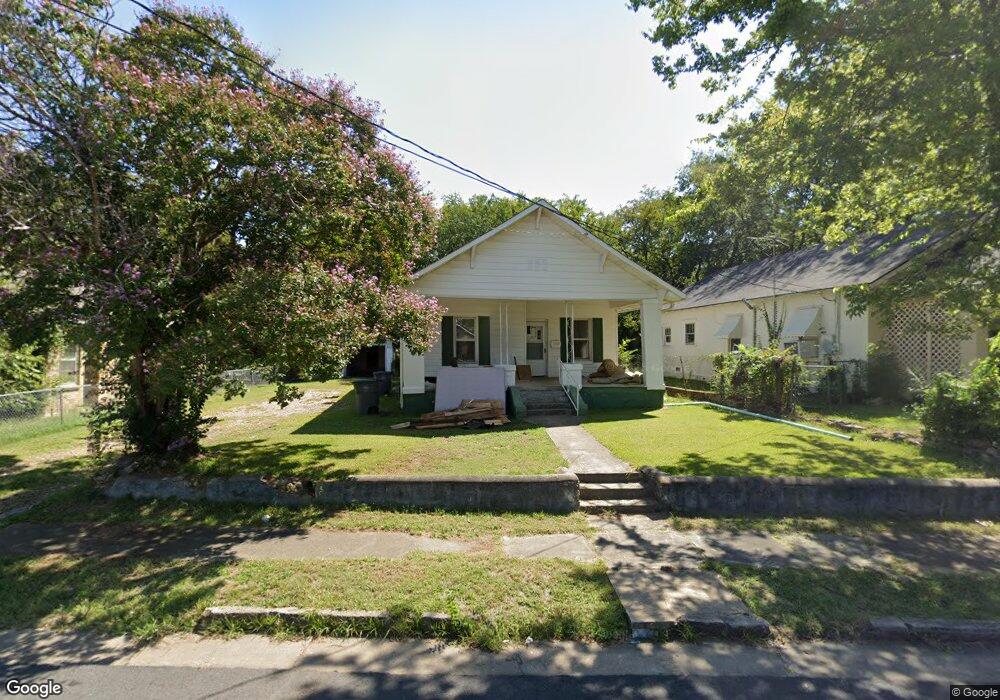
407 Oakcliff St Hot Springs National Park, AR 71901
Estimated Value: $89,000 - $110,000
--
Bed
1
Bath
1,149
Sq Ft
$87/Sq Ft
Est. Value
About This Home
This home is located at 407 Oakcliff St, Hot Springs National Park, AR 71901 and is currently estimated at $99,665, approximately $86 per square foot. 407 Oakcliff St is a home located in Garland County with nearby schools including Hot Springs World Class High School, Gospel Light Christian School, and St. Luke's Episcopal Day School.
Ownership History
Date
Name
Owned For
Owner Type
Purchase Details
Closed on
Jun 2, 2025
Sold by
Cook Raymond and Cook Evie
Bought by
Lumpkin David Beams
Current Estimated Value
Purchase Details
Closed on
Jul 29, 2010
Sold by
Munerif Sharon R
Bought by
Anderson Thoams J and Anderson Mozella S
Purchase Details
Closed on
Feb 20, 2008
Sold by
Commissioner Of State Lands
Bought by
Muncrief Sharon R
Purchase Details
Closed on
Jul 13, 2005
Sold by
Not Provided
Bought by
Muncrief Sharon R
Purchase Details
Closed on
Feb 1, 1991
Sold by
Not Provided
Bought by
Fowler Graham and Fowler Sue B
Purchase Details
Closed on
Feb 5, 1986
Bought by
Fowler Graham and Fowler Sue B
Purchase Details
Closed on
Sep 14, 1978
Bought by
Digby Mary Faith and %Muncrief Thomas E
Purchase Details
Closed on
Apr 13, 1975
Bought by
Digby Mary Faith and %Threadgill Carl D
Create a Home Valuation Report for This Property
The Home Valuation Report is an in-depth analysis detailing your home's value as well as a comparison with similar homes in the area
Home Values in the Area
Average Home Value in this Area
Purchase History
| Date | Buyer | Sale Price | Title Company |
|---|---|---|---|
| Lumpkin David Beams | $3,000 | None Listed On Document | |
| Lumpkin David Beams | $3,000 | None Listed On Document | |
| Anderson Thoams J | $10,000 | Garland County Title Company | |
| Muncrief Sharon R | $1,131 | None Available | |
| Muncrief Sharon R | $29,000 | -- | |
| Fowler Graham | -- | -- | |
| Fowler Graham | $5,500 | -- | |
| Digby Mary Faith | -- | -- | |
| Digby Mary Faith | -- | -- |
Source: Public Records
Tax History Compared to Growth
Tax History
| Year | Tax Paid | Tax Assessment Tax Assessment Total Assessment is a certain percentage of the fair market value that is determined by local assessors to be the total taxable value of land and additions on the property. | Land | Improvement |
|---|---|---|---|---|
| 2025 | $512 | $12,540 | $1,120 | $11,420 |
| 2024 | $469 | $12,540 | $1,120 | $11,420 |
| 2023 | $433 | $12,540 | $1,120 | $11,420 |
| 2022 | $397 | $12,540 | $1,120 | $11,420 |
| 2021 | $365 | $7,990 | $810 | $7,180 |
| 2020 | $365 | $7,990 | $810 | $7,180 |
| 2019 | $365 | $7,990 | $810 | $7,180 |
| 2018 | $365 | $7,990 | $810 | $7,180 |
| 2017 | $386 | $7,990 | $810 | $7,180 |
| 2016 | $406 | $8,410 | $780 | $7,630 |
| 2015 | $347 | $8,410 | $780 | $7,630 |
| 2014 | $347 | $8,410 | $780 | $7,630 |
Source: Public Records
Map
Nearby Homes
- 209 Oakcliff St
- 415 & 417 Morrison Unit Multiple addresses
- 415 Morrison Ave Unit Multiple Addresses
- 1348 Central Ave
- 108 Forest Park Place
- 212 Morrison Ave
- 110 Forest Park Place
- 205 Brad St
- 614 Oakcliff St
- 612 Oakcliff St
- 207 Hagen St
- 105 Shadow Terrace
- 109 Shadow Terrace
- 107 Liberty St
- 105 & 109 Alcorn St
- 434 Linwood Ave
- 204 Linwood Ave
- 107 Barry St
- 00 Plateau St
- 116 Manor Cir
- 409 Oakcliff St
- 405 Oakcliff St
- 109 Darby Alley
- 108 Dandy Alley
- 208 Oakcliff St
- 411 Oakcliff St
- 119 Hobson Ave
- 115 Hobson Ave
- 104 Dandy Alley
- 100 Dandy Alley
- 404 Oakcliff St
- 408 Oakcliff St
- 413 Oakcliff St
- 412 W Belding St
- 410 W Belding St
- 410 Oakcliff St
- 408 W Belding St
- 502 W Belding St
- 316 Oakcliff St
- 316 Oakcliff St Unit 310 & 312 Also