Estimated Value: $227,000 - $352,000
5
Beds
2
Baths
2,372
Sq Ft
$120/Sq Ft
Est. Value
About This Home
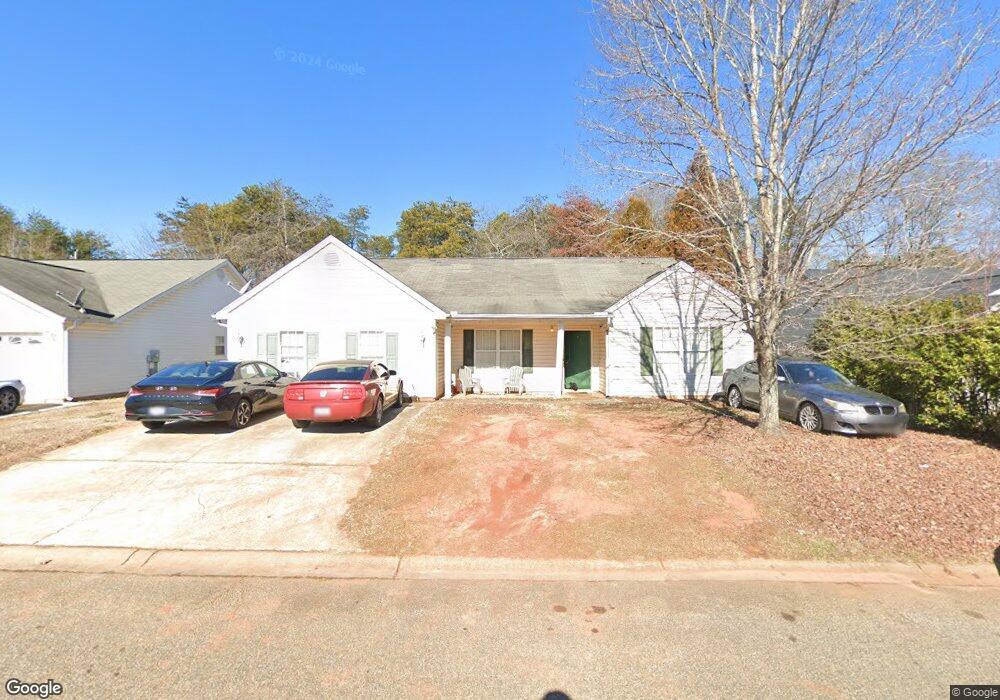
This home is located at 407 Pleasant Green Dr, Inman, SC 29349 and is currently estimated at $285,605, approximately $120 per square foot. 407 Pleasant Green Dr is a home located in Spartanburg County with nearby schools including Dorman High School Freshman Campus, Dorman High School, and Inman Christian Academy.
Ownership History
Date
Name
Owned For
Owner Type
Purchase Details
Closed on
Feb 15, 2012
Sold by
Young Paul K and Young Christine E
Bought by
Johnson Lakeisha M
Current Estimated Value
Purchase Details
Closed on
May 5, 2011
Sold by
The Secretary Of Veterans Affairs
Bought by
Young Paul K and Young Christine E
Purchase Details
Closed on
Aug 23, 2010
Sold by
Fic Krzysztof
Bought by
The Secretary Of Veterans Affairs
Purchase Details
Closed on
Oct 1, 2007
Sold by
Jarvis Wendy C and Jarvis Michael S
Bought by
Fie Krzysztof
Home Financials for this Owner
Home Financials are based on the most recent Mortgage that was taken out on this home.
Original Mortgage
$127,278
Interest Rate
6.41%
Mortgage Type
VA
Purchase Details
Closed on
Aug 30, 1999
Sold by
Seppala Homes Inc
Bought by
Jarvis Michael S and Jarvis Wendy C
Create a Home Valuation Report for This Property
The Home Valuation Report is an in-depth analysis detailing your home's value as well as a comparison with similar homes in the area
Home Values in the Area
Average Home Value in this Area
Purchase History
| Date | Buyer | Sale Price | Title Company |
|---|---|---|---|
| Johnson Lakeisha M | $118,000 | -- | |
| Young Paul K | $72,975 | -- | |
| The Secretary Of Veterans Affairs | $2,500 | -- | |
| Fie Krzysztof | $124,600 | None Available | |
| Jarvis Michael S | $99,900 | -- |
Source: Public Records
Mortgage History
| Date | Status | Borrower | Loan Amount |
|---|---|---|---|
| Previous Owner | Fie Krzysztof | $127,278 |
Source: Public Records
Tax History Compared to Growth
Tax History
| Year | Tax Paid | Tax Assessment Tax Assessment Total Assessment is a certain percentage of the fair market value that is determined by local assessors to be the total taxable value of land and additions on the property. | Land | Improvement |
|---|---|---|---|---|
| 2025 | $1,127 | $6,761 | $715 | $6,046 |
| 2024 | $1,127 | $6,761 | $715 | $6,046 |
| 2023 | $1,127 | $6,761 | $715 | $6,046 |
| 2022 | $1,044 | $5,879 | $691 | $5,188 |
| 2021 | $1,044 | $5,879 | $691 | $5,188 |
| 2020 | $1,025 | $5,879 | $691 | $5,188 |
| 2019 | $1,025 | $5,879 | $691 | $5,188 |
| 2018 | $1,025 | $5,879 | $691 | $5,188 |
| 2017 | $885 | $5,112 | $720 | $4,392 |
| 2016 | $885 | $5,112 | $720 | $4,392 |
| 2015 | $880 | $5,112 | $720 | $4,392 |
| 2014 | $850 | $5,112 | $720 | $4,392 |
Source: Public Records
Map
Nearby Homes
- 0 Bobo Dr
- 422 Mount Hood Dr
- 141 Old Settle Rd
- 138 Glassy Dr
- 433 Pleasant Green Dr
- 3652 New Cut Rd
- 329 Steelman Dr
- 3981 New Cut Rd
- 1513 Settle Rd
- 278 Wedgewood
- 290 Wedgewood Rd
- 4156 New Cut Rd
- 4210 New Cut Rd
- 361 Split Oak Ln
- 204 Fawn Meadow Dr
- 115 Hickory Hollow Rd
- 1 Dallas St
- 814 Hickory Hollow Rd
- 834 John Weaver Trace
- 4330 New Cut Rd
- 411 Pleasant Green Dr
- 403 Pleasant Green Dr
- 415 Pleasant Green Dr
- 406 Pleasant Green Dr
- 402 Pleasant Green Dr
- 410 Pleasant Green Dr
- 419 Pleasant Green Dr
- 464 Sara Blackman Dr
- 414 Pleasant Green Dr
- 460 Sara Blackman Dr
- 418 Pleasant Green Dr
- 423 Pleasant Green Dr
- 463 Sara Blackman Dr
- 422 Pleasant Green Dr
- 427 Pleasant Green Dr
- 3790 New Cut Rd
- 456 Sara Blackman Dr
- 459 Sara Blackman Dr
- 426 Pleasant Green Dr
- 3825 New Cut Rd