Estimated Value: $218,000 - $237,000
3
Beds
2
Baths
1,350
Sq Ft
$171/Sq Ft
Est. Value
About This Home
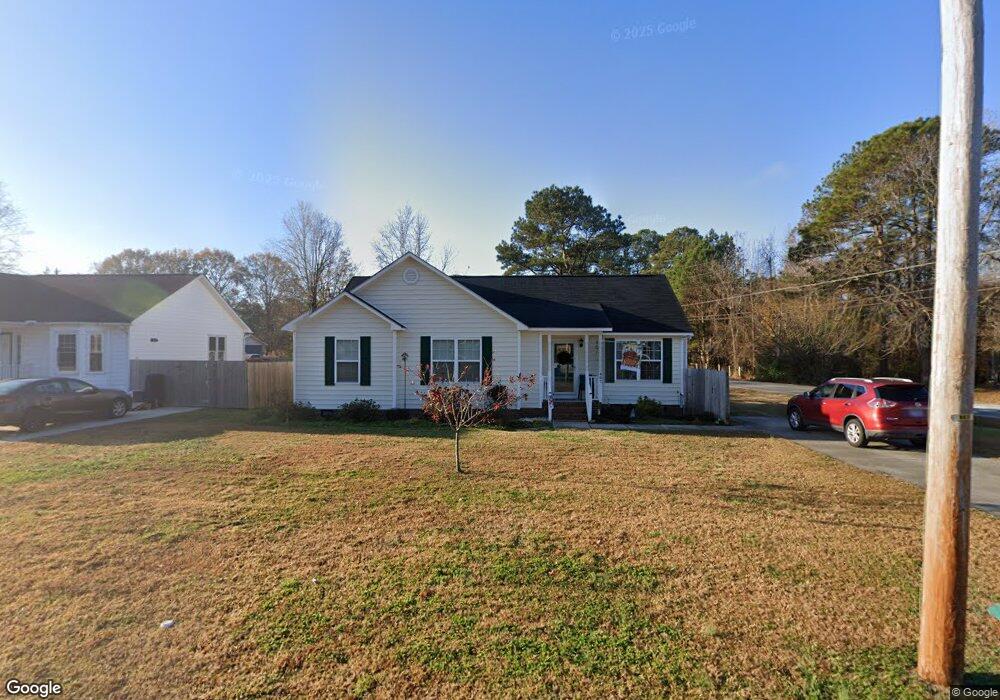
This home is located at 407 Poole Dr, Selma, NC 27576 and is currently estimated at $230,799, approximately $170 per square foot. 407 Poole Dr is a home located in Johnston County with nearby schools including Selma Elementary School, Selma Middle School, and Smithfield-Selma High School.
Ownership History
Date
Name
Owned For
Owner Type
Purchase Details
Closed on
Jan 24, 2020
Sold by
Stringfellow Richard D and Stringfellow Deborah L
Bought by
Sanderson Macey D
Current Estimated Value
Purchase Details
Closed on
Feb 25, 2019
Sold by
Brown Kenneth and Brown Patricia R
Bought by
Stringfellow Richard D and Stringfellow Deborah L
Home Financials for this Owner
Home Financials are based on the most recent Mortgage that was taken out on this home.
Original Mortgage
$121,250
Interest Rate
4.4%
Mortgage Type
New Conventional
Purchase Details
Closed on
Mar 21, 2011
Sold by
Secretary Of Veterans Affairs
Bought by
Brown Kenneth and Brown Patricia R
Purchase Details
Closed on
Aug 24, 2010
Sold by
Jefferson Howel V and Jefferson Saundra B
Bought by
Secretary Of Veterans Affairs
Purchase Details
Closed on
Jun 2, 2004
Sold by
Town Of Selma
Bought by
Jefferson Saundra
Create a Home Valuation Report for This Property
The Home Valuation Report is an in-depth analysis detailing your home's value as well as a comparison with similar homes in the area
Home Values in the Area
Average Home Value in this Area
Purchase History
| Date | Buyer | Sale Price | Title Company |
|---|---|---|---|
| Sanderson Macey D | $150,000 | None Available | |
| Stringfellow Richard D | $125,000 | None Available | |
| Brown Kenneth | -- | None Available | |
| Secretary Of Veterans Affairs | $66,098 | None Available | |
| Jefferson Saundra | $1,000 | None Available |
Source: Public Records
Mortgage History
| Date | Status | Borrower | Loan Amount |
|---|---|---|---|
| Previous Owner | Stringfellow Richard D | $121,250 |
Source: Public Records
Tax History Compared to Growth
Tax History
| Year | Tax Paid | Tax Assessment Tax Assessment Total Assessment is a certain percentage of the fair market value that is determined by local assessors to be the total taxable value of land and additions on the property. | Land | Improvement |
|---|---|---|---|---|
| 2025 | $1,227 | $219,130 | $37,500 | $181,630 |
| 2024 | $752 | $118,430 | $18,750 | $99,680 |
| 2023 | $1,528 | $118,430 | $18,750 | $99,680 |
| 2022 | $1,575 | $118,430 | $18,750 | $99,680 |
| 2021 | $1,551 | $118,430 | $18,750 | $99,680 |
| 2020 | $1,575 | $118,430 | $18,750 | $99,680 |
| 2019 | $1,428 | $109,840 | $18,750 | $91,090 |
| 2018 | $1,311 | $99,300 | $13,830 | $85,470 |
| 2017 | $1,281 | $99,300 | $13,830 | $85,470 |
| 2016 | $1,281 | $99,300 | $13,830 | $85,470 |
| 2015 | -- | $99,300 | $13,830 | $85,470 |
| 2014 | -- | $99,300 | $13,830 | $85,470 |
Source: Public Records
Map
Nearby Homes
- 412 N Green St
- 405 N Massey St
- 112 Boykin Ave
- 305 W Waddell St
- 104 N Green St
- 5437 N Carolina 39 Hwy
- 600 River Rd
- 0 N Webb St Unit 749891
- 601 W Anderson St
- 63 W Victoria Ridge Dr
- 63 W Victoria Ridge Dr Unit 31
- 0 Atkinson Mill Rd Unit 10022797
- 201 Noramac Ct
- 183 Noramac Ct
- 901 W Anderson St
- 903 W Anderson St Unit 1/2
- 303 Godwin St
- 801 River Rd
- 23 W Victoria Ridge Dr Unit 33
- 509 E Elizabeth St