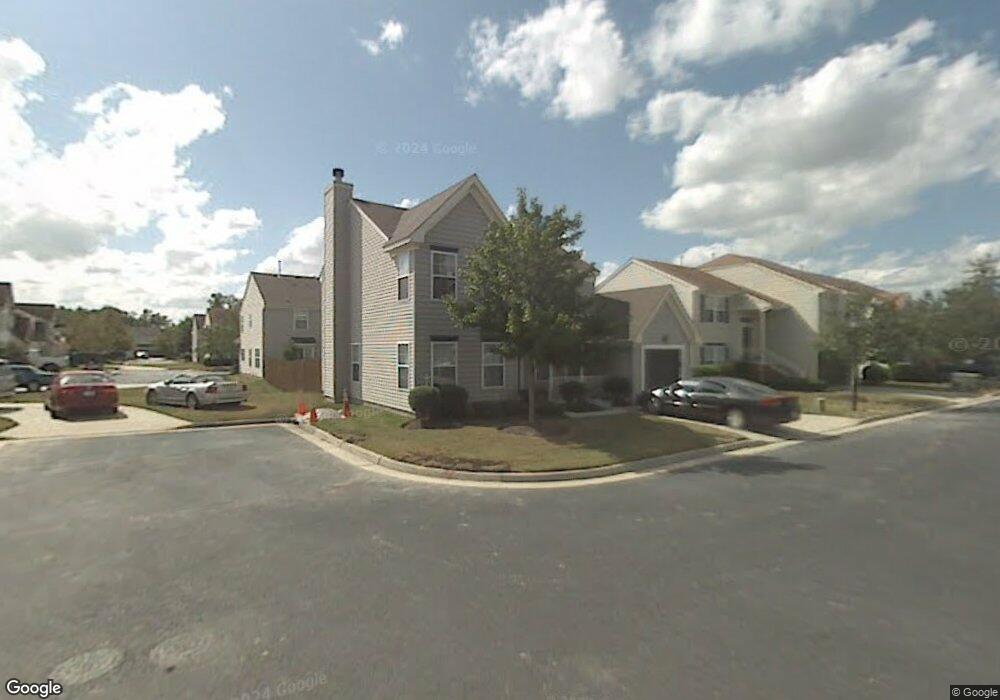
407 Prince Michael Ct Chesapeake, VA 23320
Greenbrier West NeighborhoodEstimated Value: $378,504 - $398,000
3
Beds
3
Baths
1,840
Sq Ft
$212/Sq Ft
Est. Value
About This Home
This home is located at 407 Prince Michael Ct, Chesapeake, VA 23320 and is currently estimated at $389,876, approximately $211 per square foot. 407 Prince Michael Ct is a home located in Chesapeake City with nearby schools including B.M. Williams Primary School, Crestwood Intermediate School, and Crestwood Middle School.
Ownership History
Date
Name
Owned For
Owner Type
Purchase Details
Closed on
Jul 20, 2007
Sold by
Gilkey Craig
Bought by
Ramos Ronnie C
Current Estimated Value
Home Financials for this Owner
Home Financials are based on the most recent Mortgage that was taken out on this home.
Original Mortgage
$278,941
Outstanding Balance
$175,890
Interest Rate
6.67%
Mortgage Type
VA
Estimated Equity
$213,986
Purchase Details
Closed on
Jul 15, 2003
Sold by
Litzen Jeffrey
Bought by
Gilkey Craig
Home Financials for this Owner
Home Financials are based on the most recent Mortgage that was taken out on this home.
Original Mortgage
$175,307
Interest Rate
5.81%
Mortgage Type
VA
Purchase Details
Closed on
Oct 27, 1998
Sold by
Terry and Residentia Peterson Residentia
Bought by
Litzen Jeffrey A
Home Financials for this Owner
Home Financials are based on the most recent Mortgage that was taken out on this home.
Original Mortgage
$123,522
Interest Rate
6.68%
Create a Home Valuation Report for This Property
The Home Valuation Report is an in-depth analysis detailing your home's value as well as a comparison with similar homes in the area
Home Values in the Area
Average Home Value in this Area
Purchase History
| Date | Buyer | Sale Price | Title Company |
|---|---|---|---|
| Ramos Ronnie C | $269,900 | -- | |
| Gilkey Craig | $172,500 | -- | |
| Litzen Jeffrey A | $121,500 | -- |
Source: Public Records
Mortgage History
| Date | Status | Borrower | Loan Amount |
|---|---|---|---|
| Open | Ramos Ronnie C | $278,941 | |
| Previous Owner | Gilkey Craig | $175,307 | |
| Previous Owner | Litzen Jeffrey A | $123,522 |
Source: Public Records
Tax History Compared to Growth
Tax History
| Year | Tax Paid | Tax Assessment Tax Assessment Total Assessment is a certain percentage of the fair market value that is determined by local assessors to be the total taxable value of land and additions on the property. | Land | Improvement |
|---|---|---|---|---|
| 2025 | $3,205 | $344,500 | $115,000 | $229,500 |
| 2024 | $3,205 | $317,300 | $110,000 | $207,300 |
| 2023 | $2,811 | $315,500 | $110,000 | $205,500 |
| 2022 | $2,824 | $279,600 | $90,000 | $189,600 |
| 2021 | $2,408 | $229,300 | $70,000 | $159,300 |
| 2020 | $2,414 | $229,900 | $70,000 | $159,900 |
| 2019 | $2,367 | $225,400 | $70,000 | $155,400 |
| 2018 | $2,366 | $227,400 | $60,000 | $167,400 |
| 2017 | $2,388 | $227,400 | $60,000 | $167,400 |
| 2016 | $2,388 | $227,400 | $60,000 | $167,400 |
| 2015 | $2,483 | $236,500 | $60,000 | $176,500 |
| 2014 | $2,403 | $228,900 | $60,000 | $168,900 |
Source: Public Records
Map
Nearby Homes
- 411 Prince Michael Ct
- 412 Prince Phillip Ct
- 404 Kings Bishop Ct
- 616 Lord Nelson Ct
- 1239 Basswood Ct
- 924 Wickford Dr
- 317 Shadowlake Dr
- 918 Wickford Dr
- 1210 Damyien Arch
- 1209 Alder Ct
- 508 Rue Saint La Rogue
- 113 Cottonwood Ln
- 902 Rue Marseille
- 732 Wickford Dr
- 806 Rue Marseille
- 908 Englewood Dr
- 617 Rue Marseille
- 948 Hollywood Dr
- 1509 Waitsel Dr Unit 204
- 501 Rue Marseille
- 408 Prince Phillip Ct
- 403 Prince Michael Ct
- 408 Prince Michael Ct
- 415 Prince Michael Ct
- 416 Prince Phillip Ct
- 400 Prince Michael Ct
- 412 Prince Michael Ct
- 404 Prince Phillip Ct
- 416 Prince Michael Ct
- 404 Prince Michael Ct
- 400 Prince Phillip Ct
- 407 Prince Phillip Ct
- 411 Prince Phillip Ct
- 403 Kings Gate
- 411 Kings Gate
- 415 Kings Gate
- 403 Prince Phillip Ct
- 1224 Lady Ashley Dr
- 415 Prince Phillip Ct
- 1228 Lady Ashley Dr