407 Q St SW Quincy, WA 98848
Estimated Value: $383,000 - $425,000
3
Beds
2
Baths
1,586
Sq Ft
$255/Sq Ft
Est. Value
About This Home
This home is located at 407 Q St SW, Quincy, WA 98848 and is currently estimated at $404,992, approximately $255 per square foot. 407 Q St SW is a home with nearby schools including Pioneer Elementary School, Monument Elementary School, and Quincy Middle School.
Ownership History
Date
Name
Owned For
Owner Type
Purchase Details
Closed on
May 18, 2020
Sold by
G5 Construction Lc
Bought by
Kaylor Rebekah M
Current Estimated Value
Home Financials for this Owner
Home Financials are based on the most recent Mortgage that was taken out on this home.
Original Mortgage
$247,932
Outstanding Balance
$219,220
Interest Rate
3.3%
Mortgage Type
New Conventional
Estimated Equity
$185,772
Purchase Details
Closed on
Oct 8, 2019
Sold by
Southwest Quincy Developments Lcl
Bought by
G5 Construction Lcl
Purchase Details
Closed on
Oct 3, 2014
Sold by
Quincy 132 Llc
Bought by
Southwest Quincy Development Llc
Create a Home Valuation Report for This Property
The Home Valuation Report is an in-depth analysis detailing your home's value as well as a comparison with similar homes in the area
Home Values in the Area
Average Home Value in this Area
Purchase History
| Date | Buyer | Sale Price | Title Company |
|---|---|---|---|
| Kaylor Rebekah M | $255,600 | Stewart Title Company | |
| G5 Construction Lcl | $49,000 | Grant County Title Company | |
| Southwest Quincy Development Llc | $630,253 | None Available |
Source: Public Records
Mortgage History
| Date | Status | Borrower | Loan Amount |
|---|---|---|---|
| Open | Kaylor Rebekah M | $247,932 |
Source: Public Records
Tax History Compared to Growth
Tax History
| Year | Tax Paid | Tax Assessment Tax Assessment Total Assessment is a certain percentage of the fair market value that is determined by local assessors to be the total taxable value of land and additions on the property. | Land | Improvement |
|---|---|---|---|---|
| 2025 | $2,726 | $307,594 | -- | -- |
| 2024 | $2,503 | $307,594 | $46,000 | $261,594 |
| 2023 | $1,875 | $247,000 | $46,000 | $201,000 |
| 2022 | $2,154 | $247,000 | $46,000 | $201,000 |
| 2021 | $2,038 | $247,000 | $46,000 | $201,000 |
| 2020 | $229 | $209,905 | $27,600 | $182,305 |
| 2019 | $229 | $21,600 | $21,600 | $0 |
| 2018 | $255 | $21,600 | $21,600 | $0 |
| 2017 | $251 | $21,600 | $21,600 | $0 |
| 2016 | $222 | $21,600 | $21,600 | $0 |
| 2013 | -- | $15,750 | $15,750 | $0 |
Source: Public Records
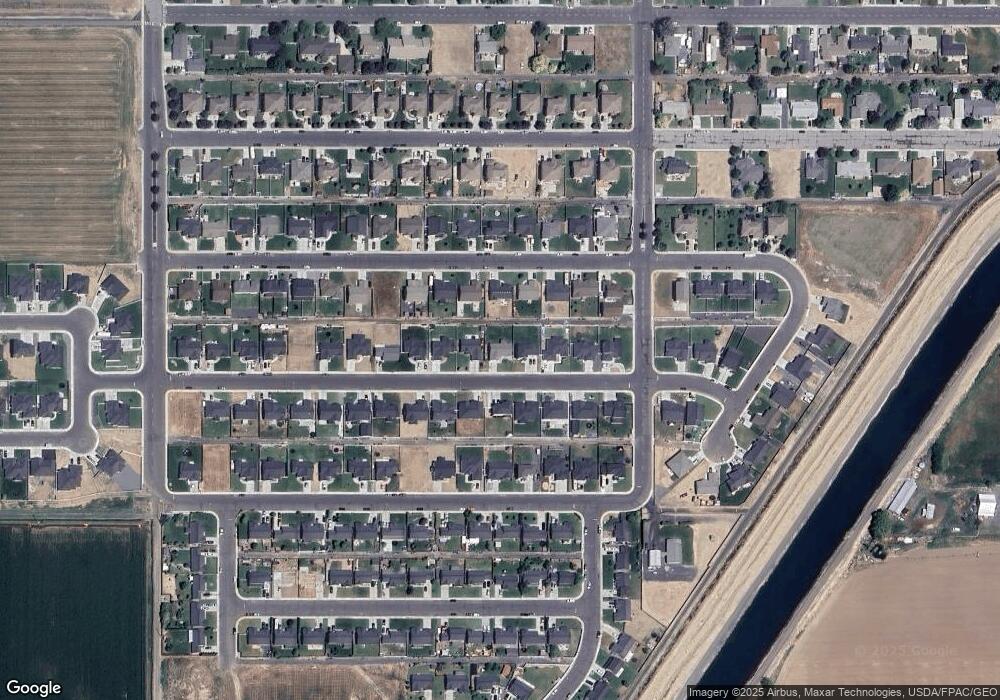
Map
Nearby Homes