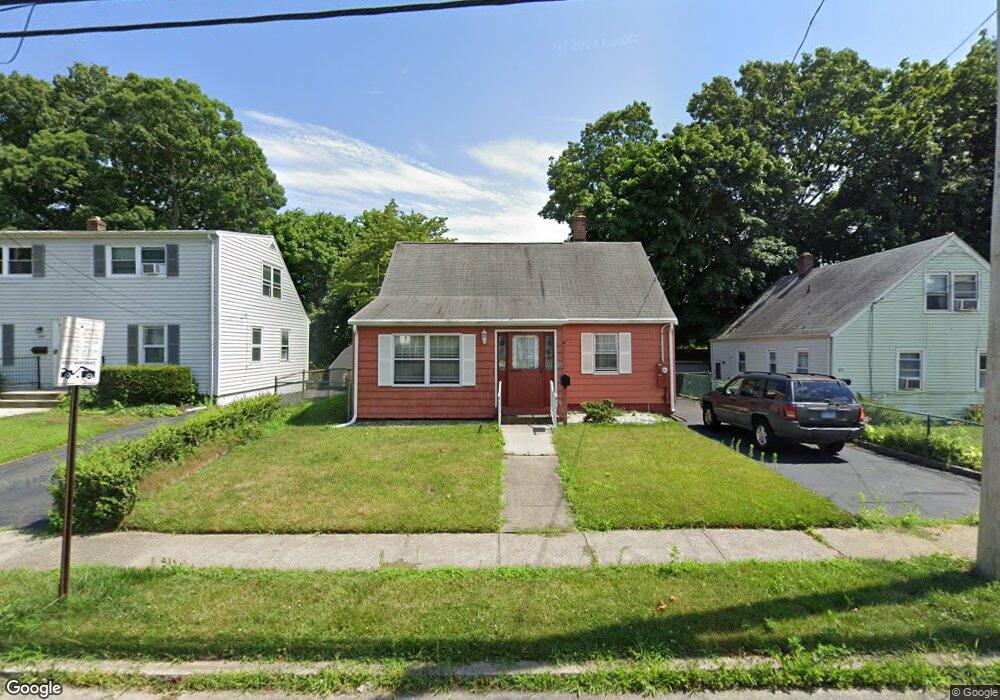
407 Queen St Bridgeport, CT 06606
North End NeighborhoodEstimated Value: $327,000 - $374,714
2
Beds
1
Bath
1,116
Sq Ft
$315/Sq Ft
Est. Value
About This Home
This home is located at 407 Queen St, Bridgeport, CT 06606 and is currently estimated at $351,679, approximately $315 per square foot. 407 Queen St is a home located in Fairfield County with nearby schools including Blackham School, Central High School, and St Andrew School.
Create a Home Valuation Report for This Property
The Home Valuation Report is an in-depth analysis detailing your home's value as well as a comparison with similar homes in the area
Home Values in the Area
Average Home Value in this Area
Tax History
We collect this data history from publicly available records. To have your information removed, we recommend requesting removal directly through your county’s website.
| Year | Tax Paid | Tax Assessment Tax Assessment Total Assessment is a certain percentage of the fair market value that is determined by local assessors to be the total taxable value of land and additions on the property. | Land | Improvement |
|---|---|---|---|---|
| 2025 | $5,870 | $135,100 | $75,310 | $59,790 |
| 2024 | $5,870 | $135,100 | $75,310 | $59,790 |
| 2023 | $5,870 | $135,100 | $75,310 | $59,790 |
| 2022 | $5,870 | $135,100 | $75,310 | $59,790 |
| 2021 | $5,870 | $135,100 | $75,310 | $59,790 |
| 2020 | $5,137 | $95,150 | $43,270 | $51,880 |
| 2019 | $5,137 | $95,150 | $43,270 | $51,880 |
| 2018 | $5,173 | $95,150 | $43,270 | $51,880 |
| 2017 | $5,173 | $95,150 | $43,270 | $51,880 |
| 2016 | $5,173 | $95,150 | $43,270 | $51,880 |
| 2015 | $5,058 | $119,850 | $49,980 | $69,870 |
| 2014 | $5,058 | $119,850 | $49,980 | $69,870 |
Source: Public Records
Map
Nearby Homes
- 415 Jewett Ave
- 316 Goldenrod Ave
- 337 Jewett Ave
- 56 Peet St
- 406 Peet St
- 409 Glendale Ave Unit C1
- 948 Wayne St
- 1095 Wayne St
- 462 Glendale Ave Unit 20
- 462 Glendale Ave Unit 11
- 64 Breyer Ave
- 557 Glendale Ave
- 200 Woodmont Ave Unit 126
- 200 Woodmont Ave Unit 118
- 200 Woodmont Ave Unit 127
- 85 Glendale Ave
- 835 Thorme St
- 26 Marsdale Ave
- 457 Vincellette St
- 210 Stratfield Place
Your Personal Tour Guide
Ask me questions while you tour the home.