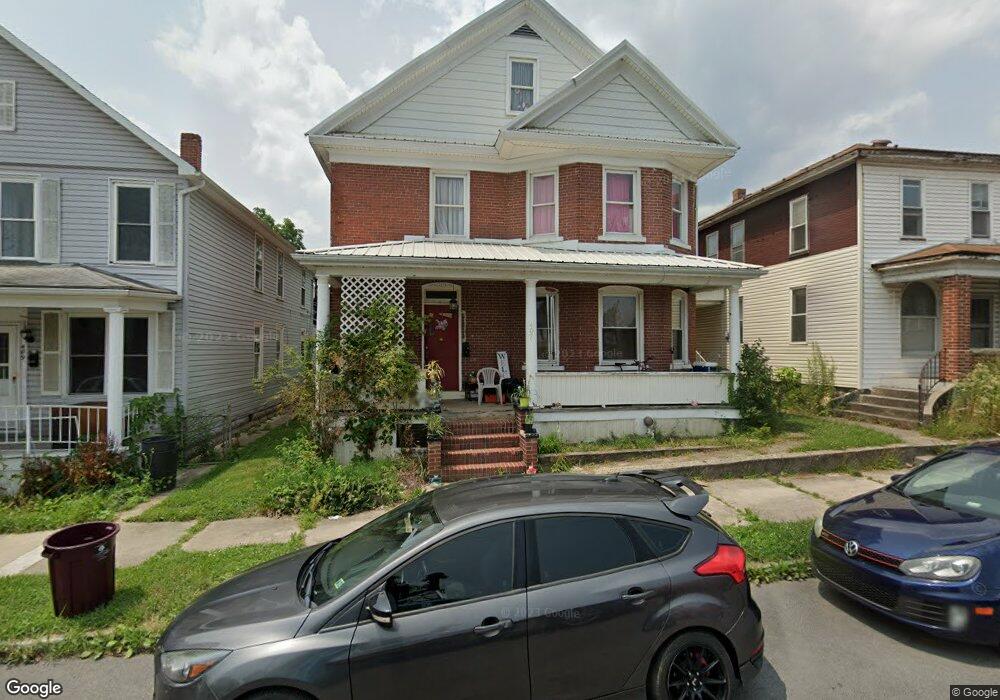
407 Race St Cumberland, MD 21502
Estimated Value: $148,000 - $197,000
5
Beds
2
Baths
1,920
Sq Ft
$91/Sq Ft
Est. Value
About This Home
This home is located at 407 Race St, Cumberland, MD 21502 and is currently estimated at $175,310, approximately $91 per square foot. 407 Race St is a home located in Allegany County with nearby schools including South Penn Elementary School, Washington Middle School, and Fort Hill High School.
Ownership History
Date
Name
Owned For
Owner Type
Purchase Details
Closed on
Dec 11, 2009
Sold by
Mihailovich Thomas W
Bought by
Loar Candi L and Loar Katherine A
Current Estimated Value
Purchase Details
Closed on
Feb 27, 2009
Sold by
Residential Funding Co Llc
Bought by
Mihailovich Thomas W
Purchase Details
Closed on
Feb 10, 2009
Sold by
Stup George G and Stup Amy L
Bought by
Residential Funding Co Llc
Purchase Details
Closed on
Oct 20, 2004
Sold by
Household Finance Corporation Iii
Bought by
Stup George G J
Purchase Details
Closed on
Apr 21, 1997
Sold by
Green William A
Bought by
Ritter Robert W and Fisher Kim F
Create a Home Valuation Report for This Property
The Home Valuation Report is an in-depth analysis detailing your home's value as well as a comparison with similar homes in the area
Purchase History
| Date | Buyer | Sale Price | Title Company |
|---|---|---|---|
| Loar Candi L | $114,900 | -- | |
| Mihailovich Thomas W | $45,000 | -- | |
| Residential Funding Co Llc | $106,250 | -- | |
| Stup George G J | $39,900 | -- | |
| Household Finance Corporation Iii | $30,207 | -- | |
| Ritter Robert W | $46,000 | -- |
Source: Public Records
Mortgage History
| Date | Status | Borrower | Loan Amount |
|---|---|---|---|
| Closed | Loar Candi L | -- |
Source: Public Records
Tax History
| Year | Tax Paid | Tax Assessment Tax Assessment Total Assessment is a certain percentage of the fair market value that is determined by local assessors to be the total taxable value of land and additions on the property. | Land | Improvement |
|---|---|---|---|---|
| 2025 | $1,072 | $135,600 | $0 | $0 |
| 2024 | $1,046 | $121,100 | $0 | $0 |
| 2023 | $992 | $106,600 | $8,000 | $98,600 |
| 2022 | $967 | $104,233 | $0 | $0 |
| 2021 | $953 | $101,867 | $0 | $0 |
| 2020 | $924 | $99,500 | $7,000 | $92,500 |
| 2019 | $930 | $99,500 | $7,000 | $92,500 |
| 2018 | $946 | $99,500 | $7,000 | $92,500 |
| 2017 | $940 | $99,500 | $0 | $0 |
| 2016 | $476 | $99,500 | $0 | $0 |
| 2015 | $921 | $99,500 | $0 | $0 |
| 2014 | $921 | $105,500 | $0 | $0 |
Source: Public Records
Map
Nearby Homes
Your Personal Tour Guide
Ask me questions while you tour the home.