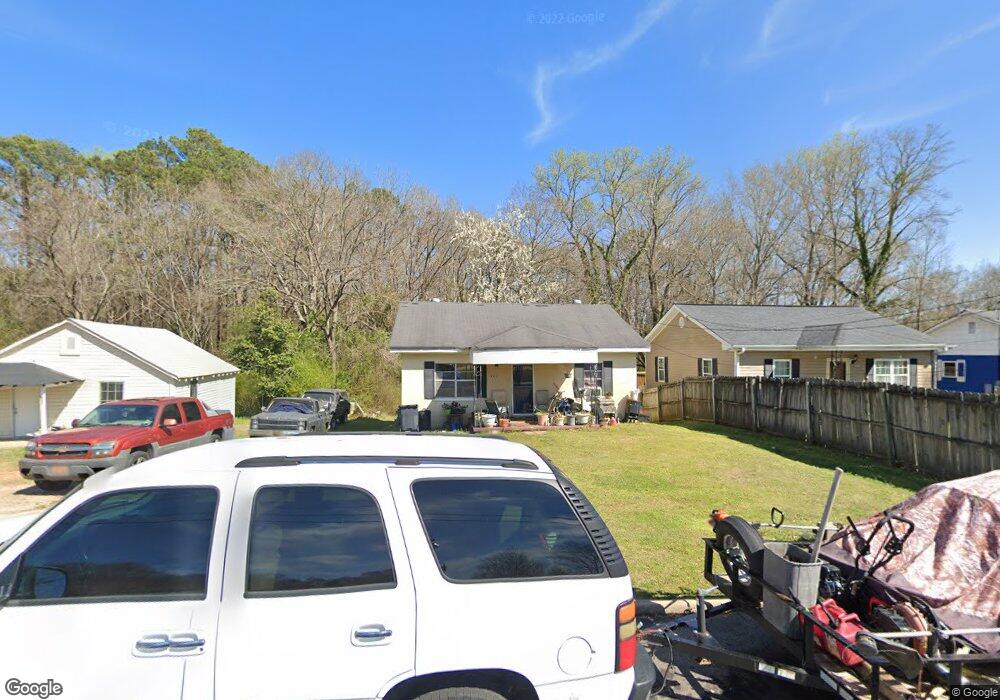
407 Render St Lagrange, GA 30241
Estimated Value: $35,000 - $100,000
2
Beds
1
Bath
900
Sq Ft
$81/Sq Ft
Est. Value
About This Home
This home is located at 407 Render St, Lagrange, GA 30241 and is currently estimated at $72,597, approximately $80 per square foot. 407 Render St is a home located in Troup County with nearby schools including Hollis Hand Elementary School, Franklin Forest Elementary School, and Ethel W. Kight Elementary School.
Ownership History
Date
Name
Owned For
Owner Type
Purchase Details
Closed on
Jun 1, 2009
Sold by
Deutsche Bank National Tru
Bought by
Eaton Doug
Current Estimated Value
Purchase Details
Closed on
Mar 3, 2009
Sold by
Dallas Jack
Bought by
Deutsche Bank National C
Purchase Details
Closed on
Dec 4, 2001
Sold by
Thelma Dallas
Bought by
Jack Dallas
Purchase Details
Closed on
Apr 24, 1985
Sold by
Gallant Louise Ramsey
Bought by
Thelma Dallas
Purchase Details
Closed on
Oct 15, 1981
Sold by
Commercial Bank & Trust Co
Bought by
Gallant Louise Ramsey
Purchase Details
Closed on
Jul 22, 1977
Sold by
Gallant James
Bought by
Commercial Bank & Trust Co
Purchase Details
Closed on
May 1, 1967
Sold by
Tasty Foods Inc
Bought by
Gallant James
Create a Home Valuation Report for This Property
The Home Valuation Report is an in-depth analysis detailing your home's value as well as a comparison with similar homes in the area
Purchase History
| Date | Buyer | Sale Price | Title Company |
|---|---|---|---|
| Eaton Doug | $9,900 | -- | |
| Eaton Doug | $9,900 | -- | |
| Deutsche Bank National C | $42,173 | -- | |
| Deutsche Bank National C | $42,173 | -- | |
| Jack Dallas | -- | -- | |
| Thelma Dallas | -- | -- | |
| Gallant Louise Ramsey | $14,000 | -- | |
| Commercial Bank & Trust Co | -- | -- | |
| Gallant James | -- | -- |
Source: Public Records
Tax History
| Year | Tax Paid | Tax Assessment Tax Assessment Total Assessment is a certain percentage of the fair market value that is determined by local assessors to be the total taxable value of land and additions on the property. | Land | Improvement |
|---|---|---|---|---|
| 2025 | $396 | $14,520 | $4,520 | $10,000 |
| 2024 | $385 | $14,120 | $4,520 | $9,600 |
| 2023 | $371 | $13,600 | $4,520 | $9,080 |
| 2022 | $364 | $13,040 | $4,520 | $8,520 |
| 2021 | $234 | $7,760 | $2,240 | $5,520 |
| 2020 | $234 | $7,760 | $2,240 | $5,520 |
| 2019 | $227 | $7,520 | $2,240 | $5,280 |
| 2018 | $227 | $7,520 | $2,240 | $5,280 |
| 2017 | $227 | $7,520 | $2,240 | $5,280 |
| 2016 | $249 | $8,241 | $2,263 | $5,978 |
| 2015 | $249 | $8,241 | $2,263 | $5,978 |
| 2014 | $240 | $7,926 | $2,263 | $5,664 |
| 2013 | -- | $8,400 | $2,263 | $6,137 |
Source: Public Records
Map
Nearby Homes
Your Personal Tour Guide
Ask me questions while you tour the home.