Estimated Value: $289,000 - $366,000
3
Beds
1
Bath
1,584
Sq Ft
$205/Sq Ft
Est. Value
About This Home
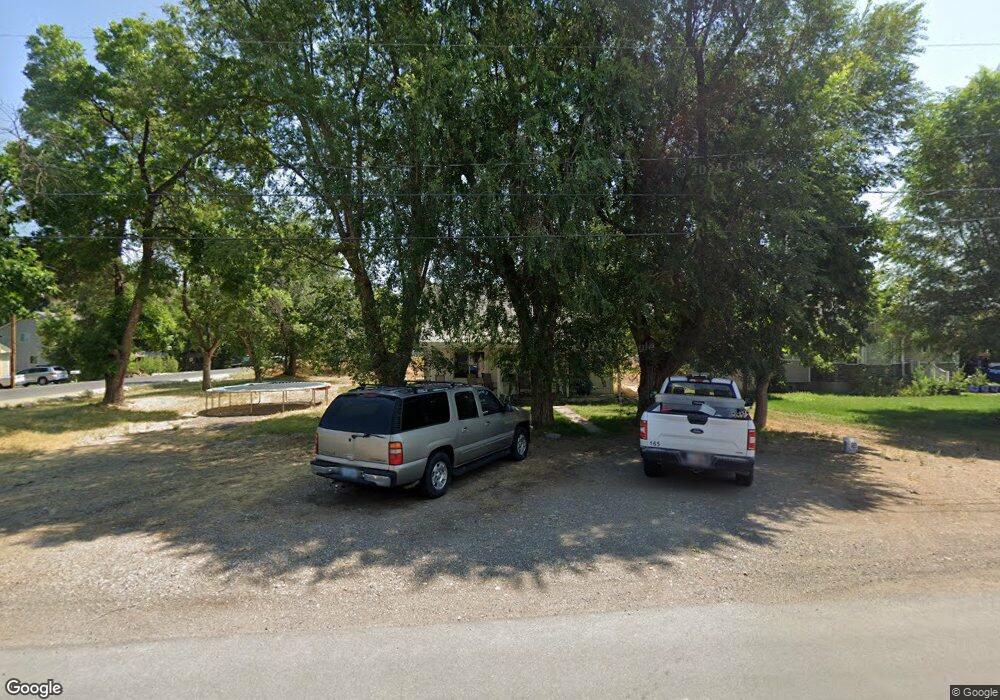
This home is located at 407 S 100 E, Hyrum, UT 84319 and is currently estimated at $324,627, approximately $204 per square foot. 407 S 100 E is a home located in Cache County with nearby schools including Canyon School, South Cache Middle School, and Mountain Crest High School.
Ownership History
Date
Name
Owned For
Owner Type
Purchase Details
Closed on
Jun 5, 2020
Sold by
Oldroyd Joshua D and Estate Of Tamera Jean Oldroyd
Bought by
Petersen Earl D and Petersen Sherry R
Current Estimated Value
Purchase Details
Closed on
Feb 15, 2012
Sold by
Morland Andilee and Morland Matthew L
Bought by
Oldroyd Tamera J
Home Financials for this Owner
Home Financials are based on the most recent Mortgage that was taken out on this home.
Original Mortgage
$49,500
Interest Rate
3.83%
Mortgage Type
New Conventional
Purchase Details
Closed on
Jul 9, 2008
Sold by
Lindley Andilee and Morland Matthew L
Bought by
Morland Andilee and Morland Matthew L
Purchase Details
Closed on
Aug 23, 2005
Sold by
Leishman Kelly N and Leishman Cindy R
Bought by
Lindley Andilee and Morland Matthew L
Home Financials for this Owner
Home Financials are based on the most recent Mortgage that was taken out on this home.
Original Mortgage
$23,180
Interest Rate
5.61%
Mortgage Type
Stand Alone Second
Create a Home Valuation Report for This Property
The Home Valuation Report is an in-depth analysis detailing your home's value as well as a comparison with similar homes in the area
Home Values in the Area
Average Home Value in this Area
Purchase History
| Date | Buyer | Sale Price | Title Company |
|---|---|---|---|
| Petersen Earl D | -- | Cache Title Logan | |
| Oldroyd Tamera J | -- | Advanced Title | |
| Morland Andilee | -- | American Secure Title | |
| Lindley Andilee | -- | Heritage West Title |
Source: Public Records
Mortgage History
| Date | Status | Borrower | Loan Amount |
|---|---|---|---|
| Previous Owner | Oldroyd Tamera J | $49,500 | |
| Previous Owner | Lindley Andilee | $23,180 |
Source: Public Records
Tax History Compared to Growth
Tax History
| Year | Tax Paid | Tax Assessment Tax Assessment Total Assessment is a certain percentage of the fair market value that is determined by local assessors to be the total taxable value of land and additions on the property. | Land | Improvement |
|---|---|---|---|---|
| 2025 | $1,153 | $165,510 | $0 | $0 |
| 2024 | $1,229 | $164,735 | $0 | $0 |
| 2023 | $1,287 | $164,985 | $0 | $0 |
| 2022 | $1,204 | $147,890 | $0 | $0 |
| 2021 | $1,113 | $210,650 | $65,050 | $145,600 |
| 2020 | $997 | $177,050 | $65,050 | $112,000 |
| 2019 | $900 | $150,400 | $38,400 | $112,000 |
| 2018 | $857 | $138,400 | $38,400 | $100,000 |
| 2017 | $593 | $49,720 | $0 | $0 |
| 2016 | $607 | $49,720 | $0 | $0 |
| 2015 | $608 | $49,720 | $0 | $0 |
| 2014 | $593 | $49,610 | $0 | $0 |
| 2013 | -- | $49,610 | $0 | $0 |
Source: Public Records
Map
Nearby Homes