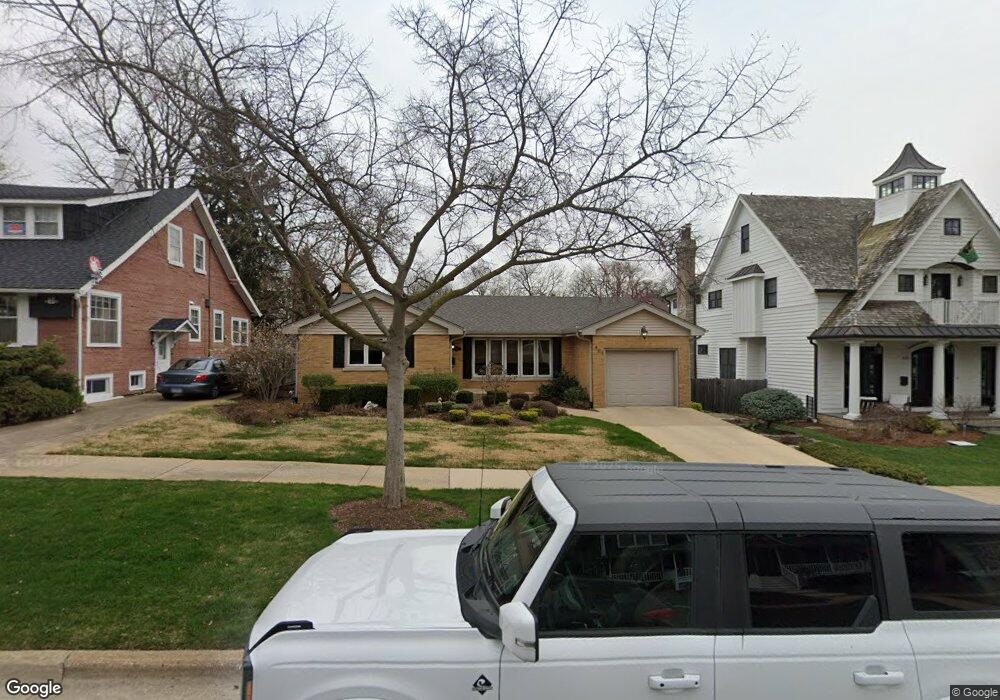
407 S Adams St Hinsdale, IL 60521
South Hinsdale NeighborhoodEstimated Value: $561,000 - $866,000
--
Bed
1
Bath
1,331
Sq Ft
$533/Sq Ft
Est. Value
About This Home
This home is located at 407 S Adams St, Hinsdale, IL 60521 and is currently estimated at $709,012, approximately $532 per square foot. 407 S Adams St is a home located in DuPage County with nearby schools including Madison Elementary School, Hinsdale Middle School, and Hinsdale Central High School.
Ownership History
Date
Name
Owned For
Owner Type
Purchase Details
Closed on
Aug 8, 2007
Sold by
Harris Na
Bought by
Aspegren Lorraine Gloria
Current Estimated Value
Purchase Details
Closed on
Jun 20, 1994
Sold by
Pelnar Dorothy P
Bought by
Owen Jeremy and Owen Vicki Kay
Home Financials for this Owner
Home Financials are based on the most recent Mortgage that was taken out on this home.
Original Mortgage
$189,900
Interest Rate
7%
Create a Home Valuation Report for This Property
The Home Valuation Report is an in-depth analysis detailing your home's value as well as a comparison with similar homes in the area
Home Values in the Area
Average Home Value in this Area
Purchase History
| Date | Buyer | Sale Price | Title Company |
|---|---|---|---|
| Aspegren Lorraine Gloria | -- | None Available | |
| Owen Jeremy | $211,000 | -- |
Source: Public Records
Mortgage History
| Date | Status | Borrower | Loan Amount |
|---|---|---|---|
| Previous Owner | Owen Jeremy | $189,900 |
Source: Public Records
Tax History Compared to Growth
Tax History
| Year | Tax Paid | Tax Assessment Tax Assessment Total Assessment is a certain percentage of the fair market value that is determined by local assessors to be the total taxable value of land and additions on the property. | Land | Improvement |
|---|---|---|---|---|
| 2024 | $8,906 | $187,787 | $83,652 | $104,135 |
| 2023 | $8,412 | $172,630 | $76,900 | $95,730 |
| 2022 | $8,557 | $174,210 | $77,610 | $96,600 |
| 2021 | $8,241 | $172,230 | $76,730 | $95,500 |
| 2020 | $8,045 | $168,820 | $75,210 | $93,610 |
| 2019 | $8,032 | $161,980 | $72,160 | $89,820 |
| 2018 | $7,143 | $150,180 | $71,760 | $78,420 |
| 2017 | $6,867 | $144,510 | $69,050 | $75,460 |
| 2016 | $6,715 | $137,920 | $65,900 | $72,020 |
| 2015 | $6,657 | $129,760 | $62,000 | $67,760 |
| 2014 | $6,220 | $118,070 | $60,280 | $57,790 |
| 2013 | $6,097 | $117,520 | $60,000 | $57,520 |
Source: Public Records
Map
Nearby Homes
- 438 S Quincy St
- 626 S Bodin St
- 608 S Quincy St
- 216 S Madison St
- 544 W 7th St
- 722 S Bruner St
- 102 S Quincy St
- 125 S Madison St
- 443 S Clay St
- 21 S Bruner St
- 14 S Thurlow St
- 28 S Clay St
- 117 N Monroe St
- 903 S Madison St
- 928 S Monroe St
- 123 N Vine St
- 118 N Grant St
- 5524 S Bruner St
- 203 Grant Ave
- 241 Coe Rd