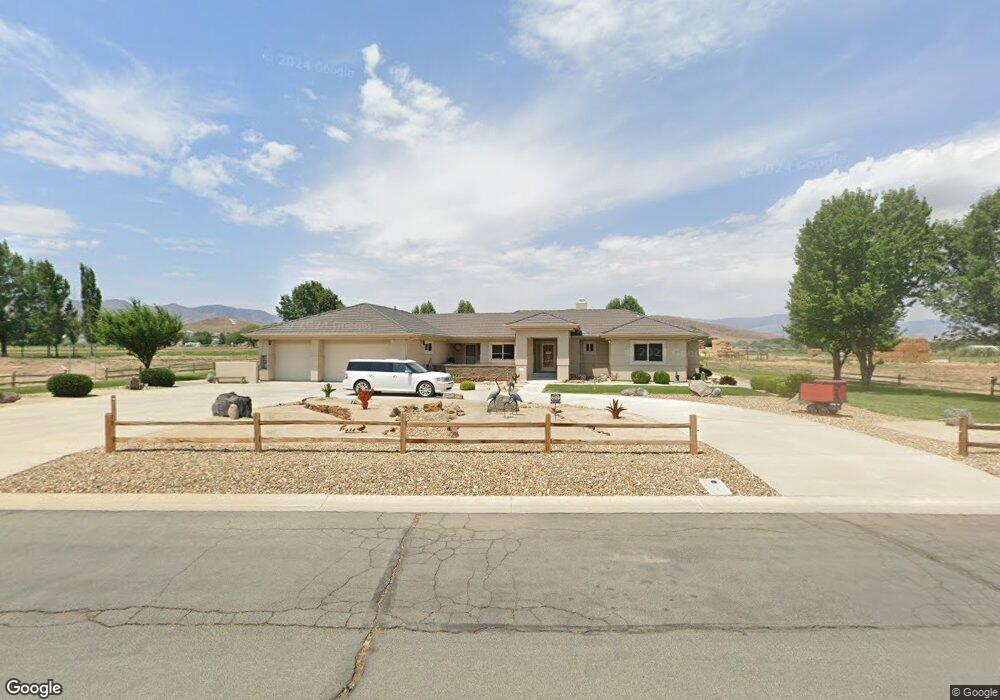
407 Tanager Rd Fernley, NV 89408
Estimated Value: $596,000 - $668,000
3
Beds
3
Baths
2,408
Sq Ft
$261/Sq Ft
Est. Value
About This Home
This home is located at 407 Tanager Rd, Fernley, NV 89408 and is currently estimated at $627,751, approximately $260 per square foot. 407 Tanager Rd is a home located in Lyon County with nearby schools including Fernley Elementary School, Fernley Intermediate School, and Fernley High School.
Create a Home Valuation Report for This Property
The Home Valuation Report is an in-depth analysis detailing your home's value as well as a comparison with similar homes in the area
Home Values in the Area
Average Home Value in this Area
Tax History Compared to Growth
Tax History
| Year | Tax Paid | Tax Assessment Tax Assessment Total Assessment is a certain percentage of the fair market value that is determined by local assessors to be the total taxable value of land and additions on the property. | Land | Improvement |
|---|---|---|---|---|
| 2025 | $3,774 | $176,492 | $54,250 | $122,242 |
| 2024 | $4,088 | $196,576 | $73,500 | $123,075 |
| 2023 | $4,088 | $189,096 | $73,500 | $115,596 |
| 2022 | $3,769 | $179,034 | $73,500 | $105,534 |
| 2021 | $3,709 | $160,636 | $57,750 | $102,886 |
| 2020 | $3,621 | $141,810 | $42,000 | $99,810 |
| 2019 | $3,456 | $127,885 | $31,500 | $96,385 |
| 2018 | $3,371 | $125,503 | $31,500 | $94,003 |
| 2017 | $3,327 | $115,017 | $21,000 | $94,017 |
| 2016 | $3,106 | $89,683 | $13,130 | $76,553 |
| 2015 | $3,139 | $88,901 | $13,130 | $75,771 |
| 2014 | $3,068 | $65,899 | $13,130 | $52,769 |
Source: Public Records
Map
Nearby Homes
- 401 Tanager Rd
- 408 Tanager Rd
- 411 Tanager Rd
- 400 Tanager Rd
- 410 Tanager Rd
- 413 Tanager Rd
- 218 Quail Run Rd
- 215 Quail Run Rd
- 414 Tanager Rd
- 213 Quail Run Rd
- 303 Avocet Ct
- 540 Stock Ln
- 415 Tanager Rd
- 499 Night Hawk Ct
- 214 Quail Run Rd
- 302 Avocet Ct
- 501 Night Hawk Ct
- 301 Avocet Ct
- 306 Peregrine Ct
- 504 Night Hawk Ct Unit 13