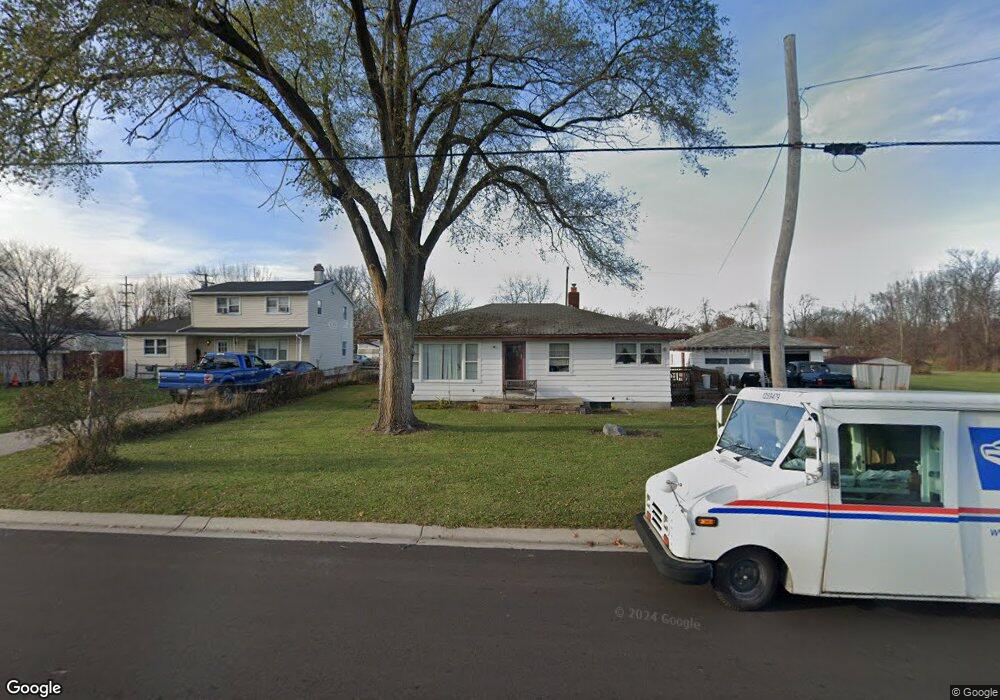
407 Taylor St Port Huron, MI 48060
Estimated Value: $130,000 - $183,000
2
Beds
1
Bath
1,064
Sq Ft
$148/Sq Ft
Est. Value
About This Home
This home is located at 407 Taylor St, Port Huron, MI 48060 and is currently estimated at $157,758, approximately $148 per square foot. 407 Taylor St is a home located in St. Clair County with nearby schools including H.D. Crull Elementary School, Holland Woods Middle School, and Port Huron High School.
Ownership History
Date
Name
Owned For
Owner Type
Purchase Details
Closed on
Nov 1, 2006
Sold by
Jacobs Juanita L
Bought by
Babcock Robert and Jacobs Juanita L
Current Estimated Value
Home Financials for this Owner
Home Financials are based on the most recent Mortgage that was taken out on this home.
Original Mortgage
$80,000
Interest Rate
6.45%
Mortgage Type
New Conventional
Purchase Details
Closed on
Sep 15, 2006
Sold by
Jacobs Ernest A and Jacobs Barbara
Bought by
Jacobs Juanita L
Home Financials for this Owner
Home Financials are based on the most recent Mortgage that was taken out on this home.
Original Mortgage
$80,000
Interest Rate
6.45%
Mortgage Type
New Conventional
Create a Home Valuation Report for This Property
The Home Valuation Report is an in-depth analysis detailing your home's value as well as a comparison with similar homes in the area
Home Values in the Area
Average Home Value in this Area
Purchase History
| Date | Buyer | Sale Price | Title Company |
|---|---|---|---|
| Babcock Robert | -- | None Available | |
| Jacobs Juanita L | -- | None Available |
Source: Public Records
Mortgage History
| Date | Status | Borrower | Loan Amount |
|---|---|---|---|
| Closed | Babcock Robert | $80,000 |
Source: Public Records
Tax History Compared to Growth
Tax History
| Year | Tax Paid | Tax Assessment Tax Assessment Total Assessment is a certain percentage of the fair market value that is determined by local assessors to be the total taxable value of land and additions on the property. | Land | Improvement |
|---|---|---|---|---|
| 2025 | $1,902 | $66,500 | $0 | $0 |
| 2024 | $1,600 | $61,500 | $0 | $0 |
| 2023 | $1,512 | $55,800 | $0 | $0 |
| 2022 | $1,566 | $49,600 | $0 | $0 |
| 2021 | $1,487 | $48,800 | $0 | $0 |
| 2020 | $1,504 | $41,900 | $41,900 | $0 |
| 2019 | $1,477 | $31,800 | $0 | $0 |
| 2018 | $1,445 | $31,800 | $0 | $0 |
| 2017 | $1,299 | $31,700 | $0 | $0 |
| 2016 | $1,108 | $31,700 | $0 | $0 |
| 2015 | $1,119 | $30,800 | $30,800 | $0 |
| 2014 | $1,119 | $31,200 | $31,200 | $0 |
| 2013 | -- | $32,600 | $0 | $0 |
Source: Public Records
Map
Nearby Homes
- 0000 Henry St
- 146 Taylor St
- 2636 Locust St
- 00 Campau Ave
- 1825 Kern St
- 1819 Kern St
- 0000 Manuel St
- 1617 Francis St
- V/L #4 Water St
- V/L #6 Water St
- V/L #5 Water St
- V/L #8 Water St
- V/L #3 Water St
- 3255 Harrington Rd
- 0000 Water St
- 423 16th St
- 0000 Campau Ave
- 1434 Nelson St
- VACANT Howard St
- 2566 Lewis Dr