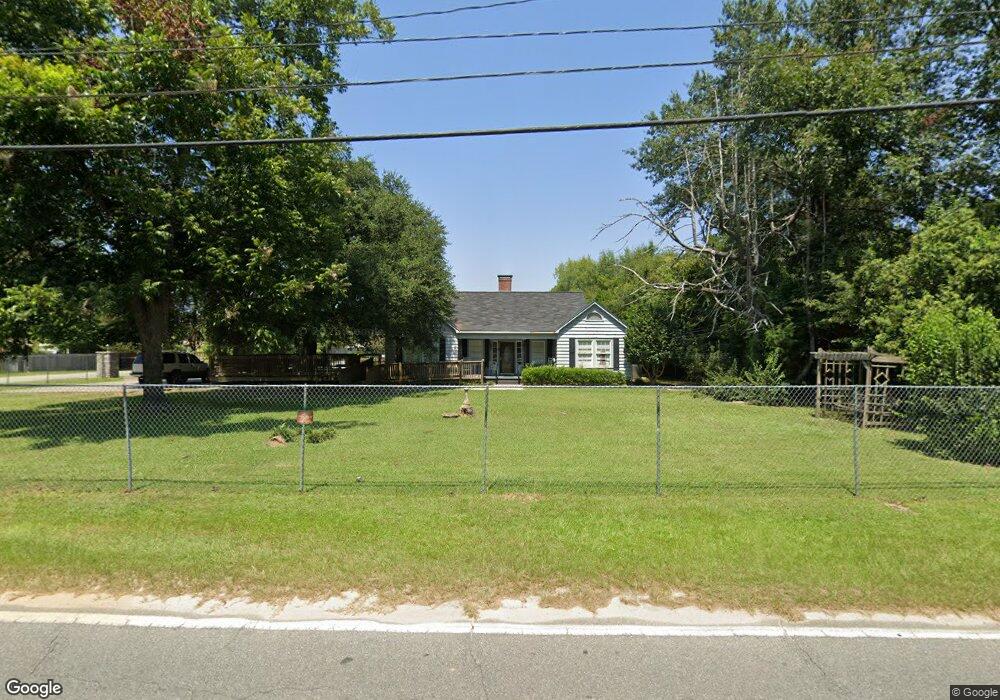
407 W Moore St Dublin, GA 31021
Estimated Value: $123,000 - $218,000
Studio
2
Baths
1,996
Sq Ft
$87/Sq Ft
Est. Value
About This Home
This home is located at 407 W Moore St, Dublin, GA 31021 and is currently estimated at $173,222, approximately $86 per square foot. 407 W Moore St is a home located in Laurens County with nearby schools including Susie Dasher, Moore Street School, and Dublin Middle School.
Ownership History
Date
Name
Owned For
Owner Type
Purchase Details
Closed on
Oct 11, 2024
Sold by
Pooler Calen
Bought by
Mmk4 Llc
Current Estimated Value
Purchase Details
Closed on
Sep 11, 2024
Sold by
Pooler Calen
Bought by
Mmk4 Llc
Purchase Details
Closed on
Dec 9, 2002
Sold by
Childers Roscoe
Bought by
Pooler Calen and Pooler Freddie
Purchase Details
Closed on
Dec 8, 1998
Sold by
Pfautsch David
Bought by
Childers Roscoe
Purchase Details
Closed on
Jun 8, 1998
Sold by
Veal Thelma B
Bought by
Pfautsch David
Purchase Details
Closed on
Sep 9, 1909
Bought by
Veal Thelma B
Create a Home Valuation Report for This Property
The Home Valuation Report is an in-depth analysis detailing your home's value as well as a comparison with similar homes in the area
Home Values in the Area
Average Home Value in this Area
Purchase History
| Date | Buyer | Sale Price | Title Company |
|---|---|---|---|
| Mmk4 Llc | -- | -- | |
| Mmk4 Llc | $650,000 | -- | |
| Pooler Calen | $25,000 | -- | |
| Childers Roscoe | $24,000 | -- | |
| Pfautsch David | $17,500 | -- | |
| Veal Thelma B | -- | -- |
Source: Public Records
Tax History
| Year | Tax Paid | Tax Assessment Tax Assessment Total Assessment is a certain percentage of the fair market value that is determined by local assessors to be the total taxable value of land and additions on the property. | Land | Improvement |
|---|---|---|---|---|
| 2024 | $1,800 | $56,446 | $6,400 | $50,046 |
| 2023 | $1,700 | $53,166 | $4,600 | $48,566 |
| 2022 | $348 | $51,582 | $4,600 | $46,982 |
| 2021 | $303 | $49,753 | $4,600 | $45,153 |
| 2020 | $377 | $52,538 | $4,600 | $47,938 |
| 2019 | $377 | $52,538 | $4,600 | $47,938 |
| 2018 | $377 | $52,538 | $4,600 | $47,938 |
| 2017 | $321 | $52,538 | $4,600 | $47,938 |
| 2016 | $417 | $57,944 | $4,600 | $53,344 |
| 2015 | $417 | $57,944 | $4,600 | $53,344 |
| 2014 | $304 | $47,384 | $6,000 | $41,384 |
Source: Public Records
Map
Nearby Homes
- 708 N Church St
- 611 W Moore St
- 906 Central Ave
- 912 Druid St
- 904 W Moore St
- 406 N Franklin St
- 702 Bellevue Ave
- 604 N Washington St
- 305 Mary St
- 312 Duncan St
- 526 Academy Ave
- 0 Woodlawn Dr
- 305 Wolfe St
- 0 E Columbia St Unit 10600868
- 712 Stonewall St
- 108 N Washington St
- 308 Rosewood Dr
- 315 S Lawrence St
- 209 Mimosa Dr
- 904 Euclid St
Your Personal Tour Guide
Ask me questions while you tour the home.