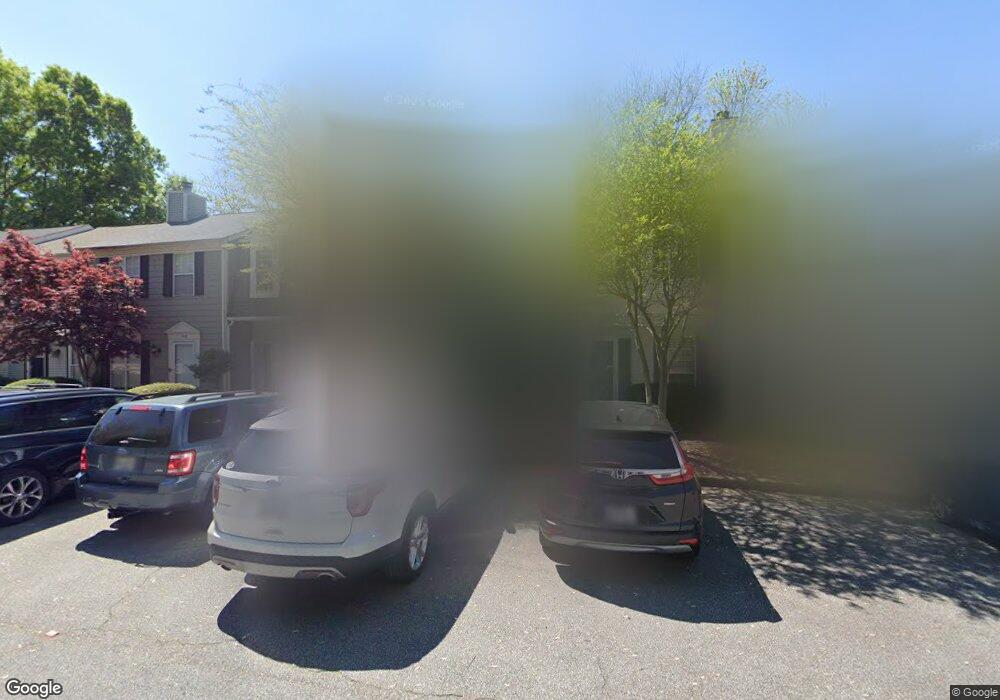
407 Wedgewood Way Unit 40 Atlanta, GA 30350
Estimated Value: $239,131 - $271,000
2
Beds
2
Baths
1,240
Sq Ft
$204/Sq Ft
Est. Value
About This Home
This home is located at 407 Wedgewood Way Unit 40, Atlanta, GA 30350 and is currently estimated at $253,033, approximately $204 per square foot. 407 Wedgewood Way Unit 40 is a home located in Fulton County with nearby schools including Dunwoody Springs Elementary School, Sandy Springs Middle School, and North Springs High School.
Ownership History
Date
Name
Owned For
Owner Type
Purchase Details
Closed on
Apr 5, 2023
Sold by
Dejmal Lauren Ann
Bought by
Dejmal Jiri
Current Estimated Value
Purchase Details
Closed on
Jun 5, 2006
Sold by
Boehrenz Michael C
Bought by
Snell Lauren A
Home Financials for this Owner
Home Financials are based on the most recent Mortgage that was taken out on this home.
Original Mortgage
$115,200
Interest Rate
6.5%
Mortgage Type
New Conventional
Purchase Details
Closed on
Apr 28, 1999
Sold by
Terry Constance M
Bought by
Boehrenz Michael C
Home Financials for this Owner
Home Financials are based on the most recent Mortgage that was taken out on this home.
Original Mortgage
$86,400
Interest Rate
7%
Mortgage Type
New Conventional
Purchase Details
Closed on
Jul 28, 1994
Sold by
Klingenberg Andrea L
Bought by
Terry Constance M
Create a Home Valuation Report for This Property
The Home Valuation Report is an in-depth analysis detailing your home's value as well as a comparison with similar homes in the area
Home Values in the Area
Average Home Value in this Area
Purchase History
| Date | Buyer | Sale Price | Title Company |
|---|---|---|---|
| Dejmal Jiri | -- | -- | |
| Snell Lauren A | $144,000 | -- | |
| Boehrenz Michael C | $108,000 | -- | |
| Terry Constance M | $69,500 | -- |
Source: Public Records
Mortgage History
| Date | Status | Borrower | Loan Amount |
|---|---|---|---|
| Previous Owner | Snell Lauren A | $115,200 | |
| Previous Owner | Boehrenz Michael C | $86,400 | |
| Closed | Terry Constance M | -- |
Source: Public Records
Tax History Compared to Growth
Tax History
| Year | Tax Paid | Tax Assessment Tax Assessment Total Assessment is a certain percentage of the fair market value that is determined by local assessors to be the total taxable value of land and additions on the property. | Land | Improvement |
|---|---|---|---|---|
| 2025 | $2,651 | $82,000 | $14,000 | $68,000 |
| 2023 | $2,205 | $78,120 | $10,480 | $67,640 |
| 2022 | $1,608 | $78,120 | $10,480 | $67,640 |
| 2021 | $1,589 | $75,800 | $10,160 | $65,640 |
| 2020 | $1,596 | $74,920 | $10,040 | $64,880 |
| 2019 | $1,509 | $69,720 | $9,040 | $60,680 |
| 2018 | $1,535 | $59,080 | $6,800 | $52,280 |
| 2017 | $1,184 | $47,280 | $5,440 | $41,840 |
| 2016 | $1,182 | $47,280 | $5,440 | $41,840 |
| 2015 | $1,186 | $47,280 | $5,440 | $41,840 |
| 2014 | $331 | $18,600 | $2,880 | $15,720 |
Source: Public Records
Map
Nearby Homes
- 502 Brandywine Cir
- 306 Brandywine Cir
- 303 Brandywine Cir Unit 303
- 102 River Run Dr
- 408 River Run Dr
- 206 River Run Dr
- 704 River Run Dr Unit 704
- 670 Riverside Rd
- 300 Cedar Knoll Ct
- 3600 Cedar Knoll Dr
- 500 River Bluff Pkwy
- 650 Corbin Lake Ct
- 2020 Rivermont Way
- 1045 Martin Ridge Rd
- 375 Winding River Dr
- 1140 Northshore Dr
- 910 Wedgewood Way
- 910 Wedgewood Way Unit 910
- 405 Wedgewood Way
- 808 Wedgewood Way
- 803 Wedgewood Way
- 1005 Wedgewood Way
- 809 Wedgewood Way
- 803 Wedgewood Way Unit 803
- 808 Wedgewood Way Unit 808
- 404 Wedgewood Way
- 408 Wedgewood Way
- 408 Wedgewood Way Unit 408
- 403 Wedgewood Way
- 409 Wedgewood Way
- 409 Wedgewood Way Unit 409
- 908 Wedgewood Way Unit 54
- 907 Wedgewood Way
- 805 Wedgewood Way
- 807 Wedgewood Way
- 1007 Wedgewood Way