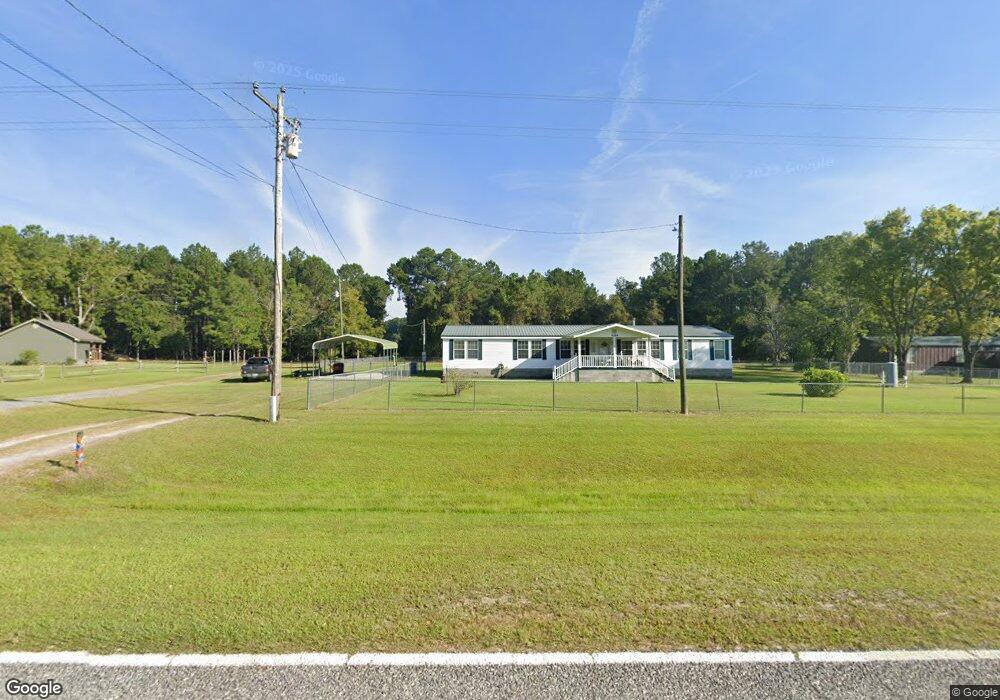
4070 Dixie Union Rd Waycross, GA 31503
Estimated Value: $61,000 - $149,000
3
Beds
3
Baths
1,280
Sq Ft
$82/Sq Ft
Est. Value
About This Home
This home is located at 4070 Dixie Union Rd, Waycross, GA 31503 and is currently estimated at $104,991, approximately $82 per square foot. 4070 Dixie Union Rd is a home located in Ware County with nearby schools including Wacona Elementary School, Ware County Middle School, and Ware County High School.
Ownership History
Date
Name
Owned For
Owner Type
Purchase Details
Closed on
Sep 26, 2016
Sold by
Colleen E
Bought by
Lee Randy M
Current Estimated Value
Purchase Details
Closed on
Jan 19, 2007
Sold by
Anderson John D
Bought by
Lee Colleen E and Lee Randy M
Purchase Details
Closed on
Mar 3, 2004
Sold by
Lightsey Linda K
Bought by
Anderson John D and Anderson Sandra M
Purchase Details
Closed on
Sep 8, 2000
Sold by
Lightsey Linda K and Lightsey H
Bought by
Lightsey Linda K
Purchase Details
Closed on
Apr 1, 1998
Sold by
Smith Rohena K
Bought by
Lightsey Linda K and Lightsey H
Purchase Details
Closed on
Aug 3, 1992
Bought by
Smith Rohena K
Purchase Details
Closed on
May 1, 1983
Create a Home Valuation Report for This Property
The Home Valuation Report is an in-depth analysis detailing your home's value as well as a comparison with similar homes in the area
Home Values in the Area
Average Home Value in this Area
Purchase History
| Date | Buyer | Sale Price | Title Company |
|---|---|---|---|
| Lee Randy M | $8,500 | -- | |
| Lee Colleen E | $132,000 | -- | |
| Anderson John D | -- | -- | |
| Lightsey Linda K | -- | -- | |
| Lightsey Linda K | -- | -- | |
| Smith Rohena K | -- | -- | |
| Smith Gary J | -- | -- | |
| -- | -- | -- |
Source: Public Records
Tax History Compared to Growth
Tax History
| Year | Tax Paid | Tax Assessment Tax Assessment Total Assessment is a certain percentage of the fair market value that is determined by local assessors to be the total taxable value of land and additions on the property. | Land | Improvement |
|---|---|---|---|---|
| 2024 | $483 | $16,703 | $13,356 | $3,347 |
| 2023 | $232 | $8,041 | $5,019 | $3,022 |
| 2022 | $232 | $8,041 | $5,019 | $3,022 |
| 2021 | $202 | $6,441 | $5,019 | $1,422 |
| 2020 | $204 | $6,441 | $5,019 | $1,422 |
| 2019 | $208 | $6,441 | $5,019 | $1,422 |
| 2018 | $210 | $6,441 | $5,019 | $1,422 |
| 2017 | $310 | $6,441 | $5,019 | $1,422 |
Source: Public Records
Map
Nearby Homes
- 4095 Otis Ln
- 4263 N River Rd
- 26 Acres Telmore-Dixie Union Rd
- 4545 Oak View Cir
- 4535 Oak View Cir
- 4525 Oak View Rd
- S S River Rd
- 5790 Wooddell Dr
- 5625 Wooddell Dr
- 4600 Alma Hwy
- 4818 Lovett Rd
- Lot 2 Smith Ln
- 4717 Smith Ln
- 3750 Little Hurricane Creek Rd
- 4517 Cameron Ln
- 0 Jamestown Rd Unit 25595234
- 0 Jamestown Rd Unit 25595235
- 0 Jamestown Rd Unit 10575588
- 0 Jamestown Rd Unit 1655675
- 0 Jamestown Rd Unit 25323571
- 6550 Alma Hwy Dixie Union
- 6534 Alma Hwy
- 6528 Alma Hwy
- 6546 Alma Hwy
- 6524 Alma Hwy
- 6562 Alma Hwy
- 4076 Dixie Union Rd
- 6566 Alma Hwy
- 4030 Dixie Union Rd
- 4061 Dixie Union Rd
- 4055 Dixie Union Rd
- 4049 Dixie Union Rd
- 4073 Dixie Union Rd
- 6578 Alma Hwy
- 4067 Dixie Union Rd
- 6543 Twyman Smith Rd
- 4029 Dixie Union Rd
- 6482 Alma Hwy
- 6482 Alma Hwy
- 6483 Ed King Ln