
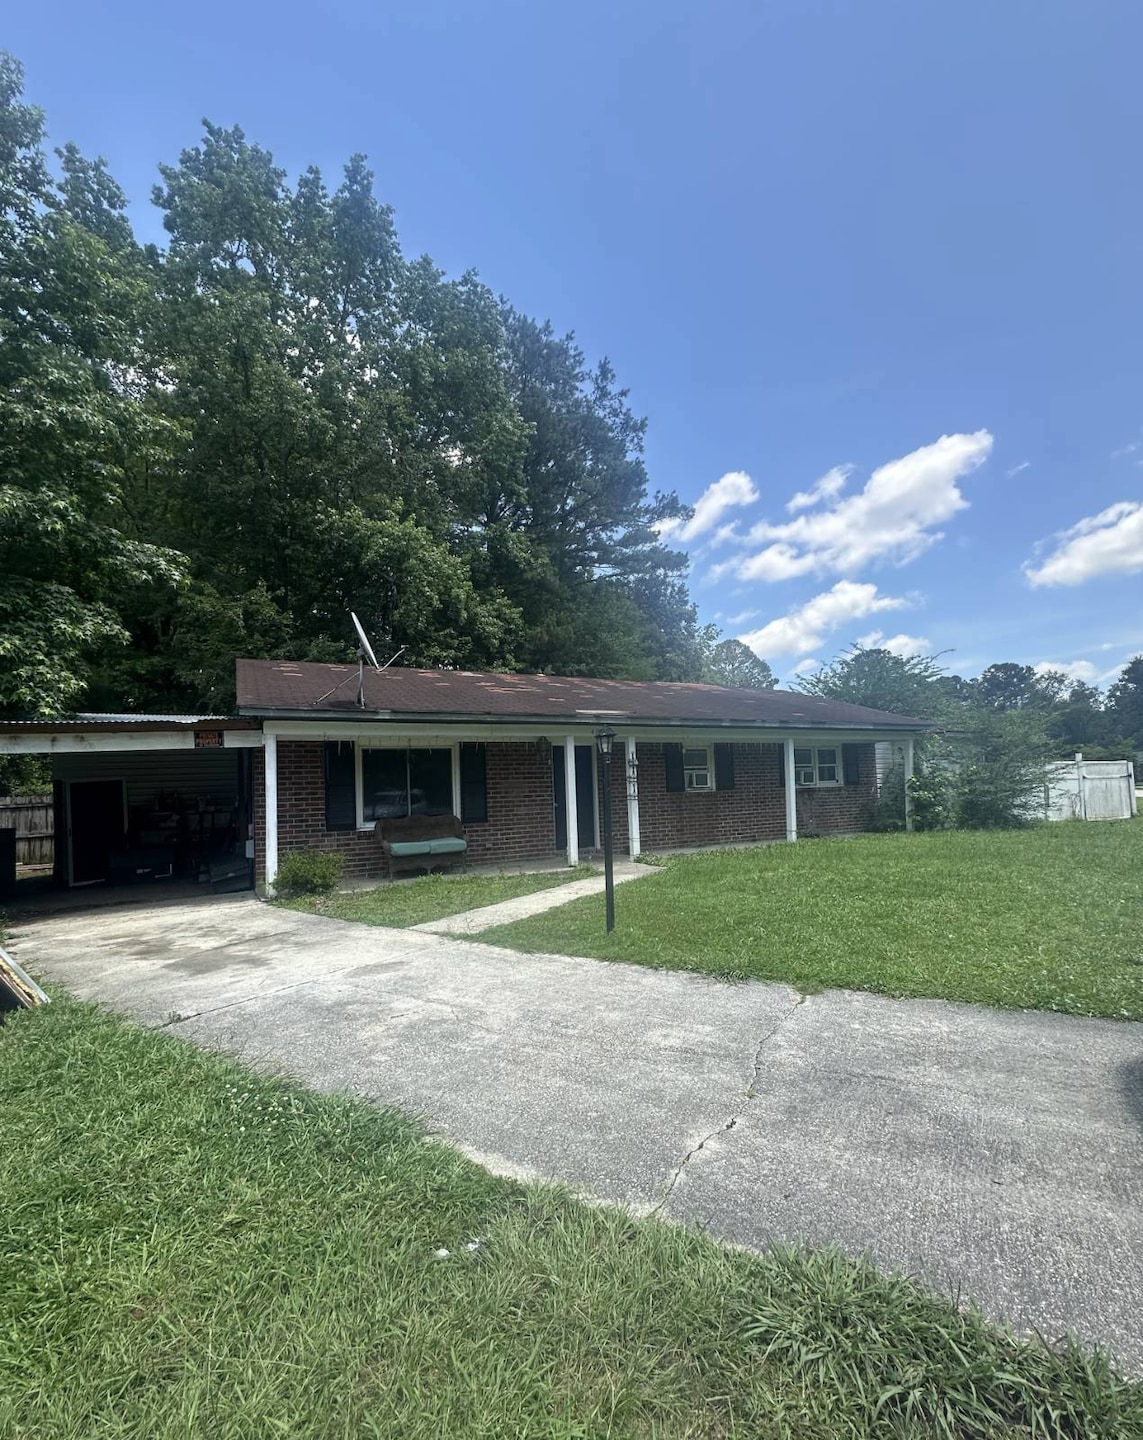
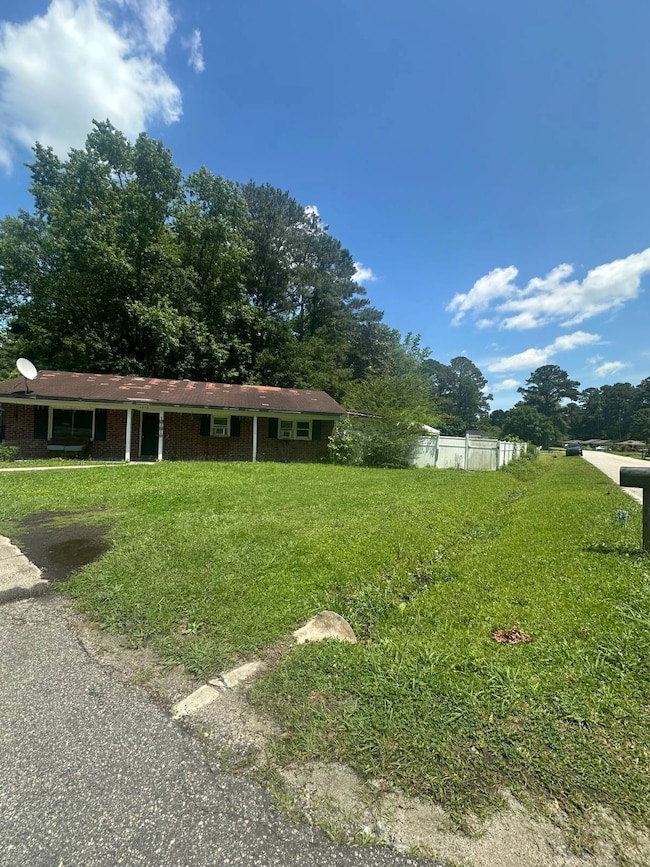
4070 Halyard Way Unit MB Myrtle Beach, SC 29579
Estimated payment $2,124/month
Total Views
73,639
3
Beds
3
Baths
1,600
Sq Ft
$234
Price per Sq Ft
Highlights
- Den
- Covered Patio or Porch
- Galley Kitchen
- Forestbrook Elementary School Rated A
- Breakfast Room
- Living Room
About This Home
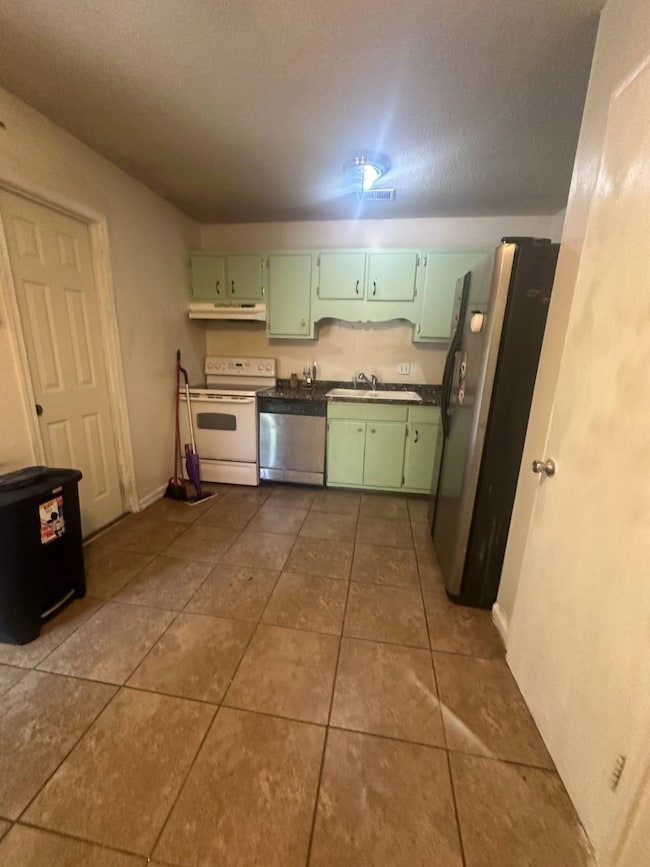
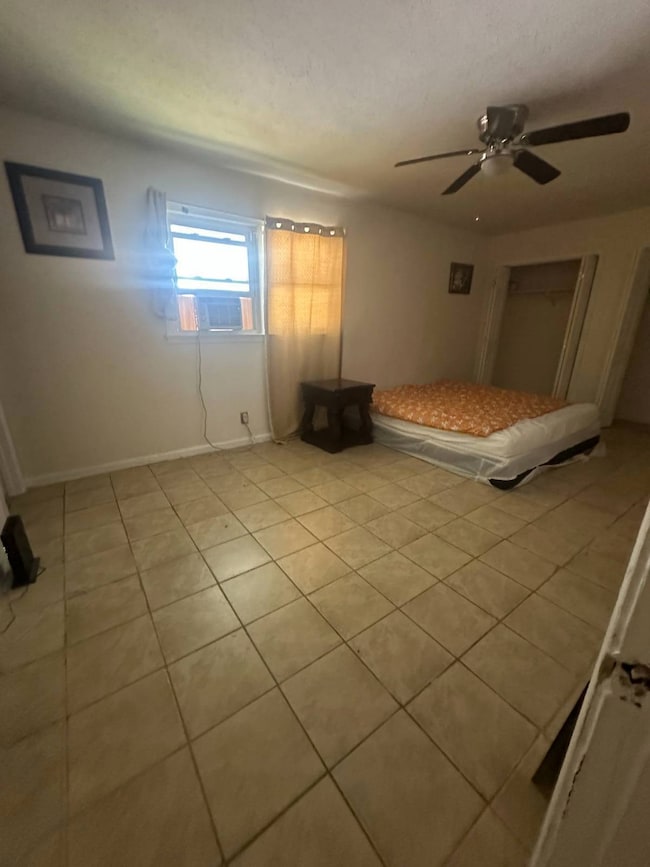
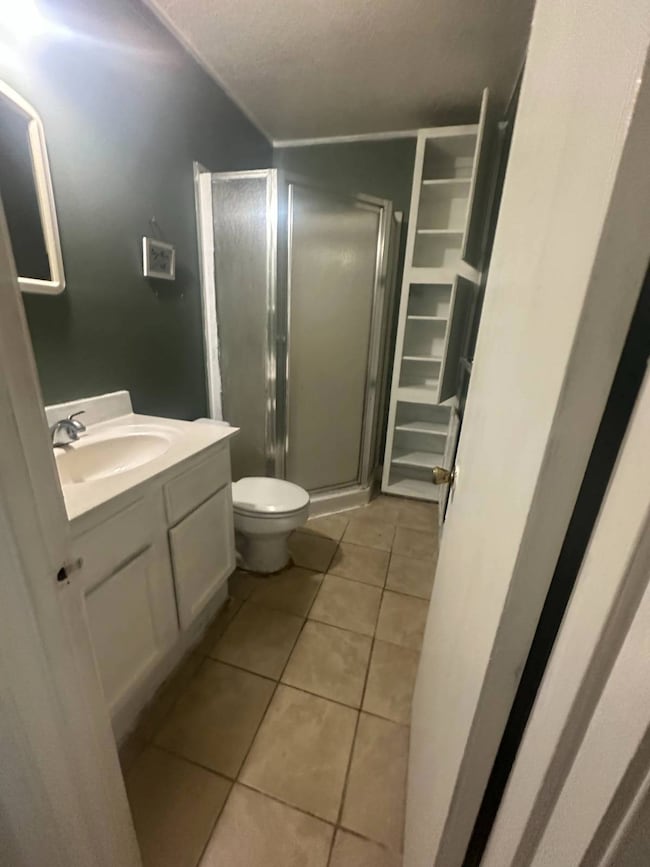
Welcome to your next investment opportunity-or your new home sweet home-in the heart of Myrtle Beach, SC. Listed at $375,000, this versatile property offers endless potential, whether you're looking to generate income or create a unique single-family residence tailored to your lifestyle. Perfectly situated on a spacious corner lot, this home boasts a large fenced-in backyard-ideal for entertaining, gardening, or simply enjoying your own private oasis. Even better, a camper in the backyard can be included with an acceptable offer, adding even more value and flexibility. The current layout offers a duplex-style setup, featuring a 2-bedroom, 2-bathroom unit on one side, and a separate 1-bedroom, 1-bathroom unit with its own entrance on the other. Live in one and rent the other, or accommodate extended family, guests, or even a work-from-home setup with ease. Prefer a single-family layout? With minimal adjustments, the property can be converted into a spacious 3-bedroom, 3-bathroom home complete with the option for an in-law suite or private space for teens or young adults. This is your chance to own a property that adapts to your needs in a thriving coastal community. Whether you're an investor, multi-generational household, or simply looking for a home with options, this Myrtle Beach gem delivers. Don't miss out on this rare find.
Home Details
Home Type
- Single Family
Est. Annual Taxes
- $1,776
Year Built
- Built in 1981
Lot Details
- 0.31 Acre Lot
- Fenced
Parking
- Driveway
Home Design
- Brick Exterior Construction
- Frame Construction
- Asphalt Roof
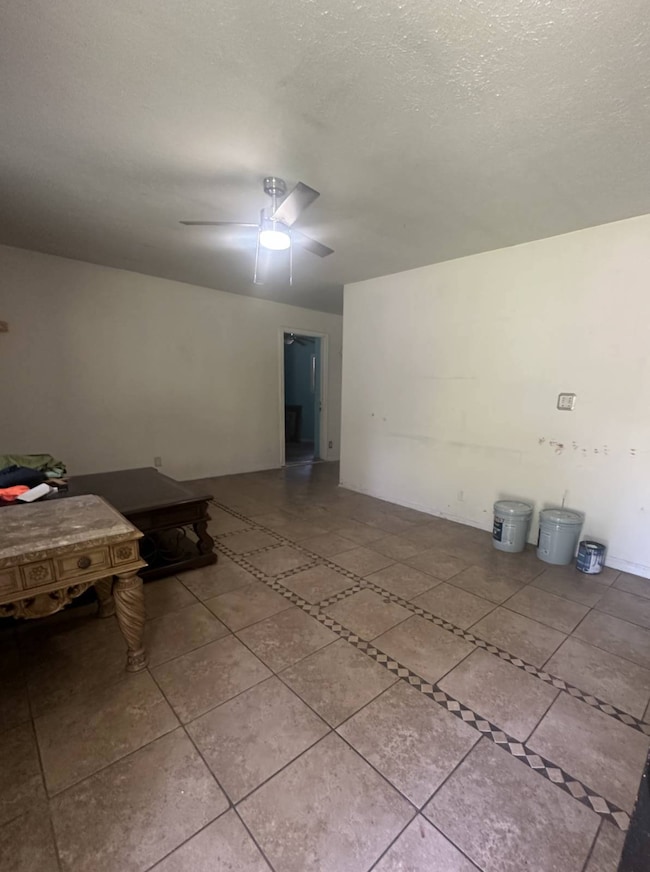
Interior Spaces
- 1,600 Sq Ft Home
- 1-Story Property
- Living Room
- Breakfast Room
- Den
- Tile Flooring
Kitchen
- Galley Kitchen
- Oven
Bedrooms and Bathrooms
- 3 Bedrooms
- 3 Full Bathrooms
Laundry
- Laundry Room
- Dryer
- Washer
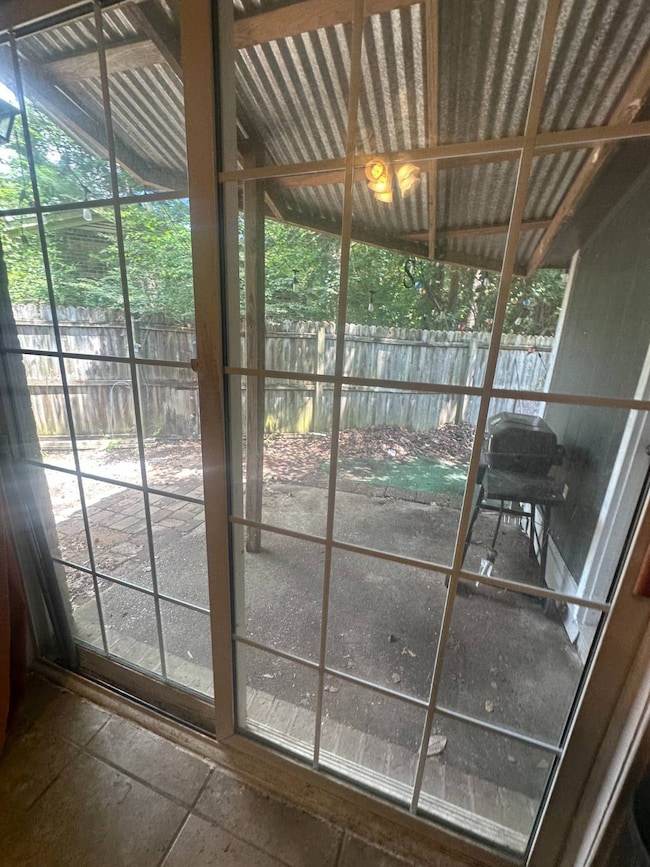
Outdoor Features
- Covered Patio or Porch
- Shed
Utilities
- Central Air
- Heat Pump System
- Water Heater
Map
Create a Home Valuation Report for This Property
The Home Valuation Report is an in-depth analysis detailing your home's value as well as a comparison with similar homes in the area
Home Values in the Area
Average Home Value in this Area
Tax History
| Year | Tax Paid | Tax Assessment Tax Assessment Total Assessment is a certain percentage of the fair market value that is determined by local assessors to be the total taxable value of land and additions on the property. | Land | Improvement |
|---|---|---|---|---|
| 2024 | $1,776 | $12,785 | $5,565 | $7,220 |
| 2023 | $1,776 | $7,297 | $1,633 | $5,664 |
| 2021 | $1,642 | $4,864 | $1,088 | $3,776 |
| 2020 | $1,148 | $4,864 | $1,088 | $3,776 |
| 2019 | $1,148 | $7,297 | $1,633 | $5,664 |
| 2018 | $0 | $4,681 | $1,843 | $2,838 |
| 2017 | $1,025 | $4,681 | $1,843 | $2,838 |
| 2016 | -- | $4,681 | $1,843 | $2,838 |
| 2015 | $1,025 | $4,682 | $1,844 | $2,838 |
| 2014 | $286 | $4,682 | $1,844 | $2,838 |
Source: Public Records
Property History
| Date | Event | Price | List to Sale | Price per Sq Ft |
|---|---|---|---|---|
| 06/08/2025 06/08/25 | For Sale | $375,000 | -- | $234 / Sq Ft |
Source: My State MLS
Purchase History
| Date | Type | Sale Price | Title Company |
|---|---|---|---|
| Deed | $145,500 | None Available | |
| Deed | -- | -- | |
| Warranty Deed | $96,200 | -- |
Source: Public Records
Mortgage History
| Date | Status | Loan Amount | Loan Type |
|---|---|---|---|
| Open | $21,825 | Credit Line Revolving | |
| Open | $116,400 | Fannie Mae Freddie Mac | |
| Previous Owner | $86,580 | Purchase Money Mortgage | |
| Closed | $0 | Assumption |
Source: Public Records
About the Listing Agent
Selling your home doesn’t have to be a hassle. Unfortunately last year half of the houses that came on the market did not sell the first time with the first agent the seller chose. These sellers found that there was a tremendous amount a homeowner needed to be educated on to sell their home for top dollar in the shortest time period.
At TMS Property Management and Realty – Your Home Sold Guaranteed or We’ll Buy It! We know you want to get your home sold the first time. We will show you
Tina's Other Listings
Source: My State MLS
MLS Number: 11513310
APN: 41714030052
Nearby Homes
- 4059 Long Line Ln
- 746 Gumbo Limbo Ln
- 4300 Summit Trail
- 4050 Shipyard Walk
- 4280 Hunting Bow Trail
- 4336 Summit Trail Unit MB
- 336 Vintage Cir
- 5344 Grosseto Way
- 875 Brookline Dr
- 4380 Livorn Loop Unit 4380
- 720 Gazania Ln
- 4351 Dew North Ct
- 4246 Livorn Loop
- 5012 Prato Loop Unit 5012
- 4348 Livorn Loop Unit 4348
- 5048 Prato Loop Unit 5048
- 5231 Casentino Ct
- 1169 Bethpage Dr
- 817 Arezzo Way Unit 1001 - Brookhaven
- 819 Brookline Dr
- 950 Forestbrook Rd
- 101 Rexford Ct
- 755 Burcale Rd Unit H-2
- 8160 Forest Edge Dr
- 801 Burcale Rd Unit D6
- 106 Fountain Pointe Ln Unit 102
- 110 Fountain Pointe Ln Unit 110 Fountain Pointe Lane
- 3691 Clay Pond Rd
- 8196 Forest Edge Dr
- 3926 Wesley St
- 136 Talladega Dr
- 303 Golan Cir Unit E
- 2129 Victory Way
- 1683 Palmetto Palm Dr
- 650 W Flintlake Ct
- 1863 Villena Dr
- 1113 Peace Pipe Place Unit 204
- 268 Legends Village Loop
- 5435 Shelly Lynn Dr Unit Furnished at Bella Vita
- 1145 Peace Pipe Place Unit 101