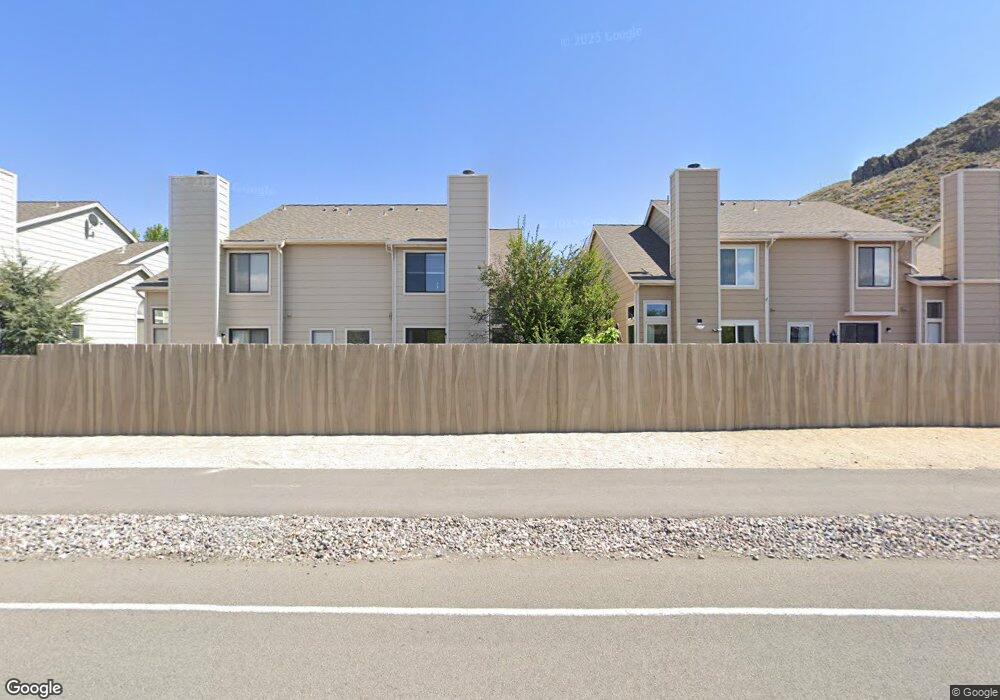
4071 Leeward Ct Unit 1 Reno, NV 89502
Hidden Valley NeighborhoodEstimated Value: $418,343 - $468,000
2
Beds
3
Baths
1,313
Sq Ft
$335/Sq Ft
Est. Value
About This Home
This home is located at 4071 Leeward Ct Unit 1, Reno, NV 89502 and is currently estimated at $439,836, approximately $334 per square foot. 4071 Leeward Ct Unit 1 is a home located in Washoe County with nearby schools including Donner Springs Elementary School, Edward L Pine Middle School, and Damonte Ranch High School.
Ownership History
Date
Name
Owned For
Owner Type
Purchase Details
Closed on
Aug 4, 2022
Sold by
Michael Evans Scott
Bought by
Scott And Emily Evans Family Trust
Current Estimated Value
Purchase Details
Closed on
May 13, 2002
Sold by
Rhoden Patricia and Rhoden Donald
Bought by
Evans Scott M
Home Financials for this Owner
Home Financials are based on the most recent Mortgage that was taken out on this home.
Original Mortgage
$126,500
Interest Rate
6.83%
Purchase Details
Closed on
Mar 15, 1996
Sold by
Farrell Christopher P and Farrell Karen L
Bought by
Rhoden Donald and Rhoden Patricia
Home Financials for this Owner
Home Financials are based on the most recent Mortgage that was taken out on this home.
Original Mortgage
$119,946
Interest Rate
7.01%
Mortgage Type
FHA
Create a Home Valuation Report for This Property
The Home Valuation Report is an in-depth analysis detailing your home's value as well as a comparison with similar homes in the area
Home Values in the Area
Average Home Value in this Area
Purchase History
| Date | Buyer | Sale Price | Title Company |
|---|---|---|---|
| Scott And Emily Evans Family Trust | -- | None Listed On Document | |
| Evans Scott M | $159,500 | First American Title | |
| Rhoden Donald | $123,000 | Stewart Title |
Source: Public Records
Mortgage History
| Date | Status | Borrower | Loan Amount |
|---|---|---|---|
| Previous Owner | Evans Scott M | $126,500 | |
| Previous Owner | Rhoden Donald | $119,946 | |
| Closed | Evans Scott M | $25,000 |
Source: Public Records
Tax History Compared to Growth
Tax History
| Year | Tax Paid | Tax Assessment Tax Assessment Total Assessment is a certain percentage of the fair market value that is determined by local assessors to be the total taxable value of land and additions on the property. | Land | Improvement |
|---|---|---|---|---|
| 2025 | $2,017 | $67,130 | $32,802 | $34,328 |
| 2024 | $2,017 | $65,675 | $29,838 | $35,838 |
| 2023 | $1,868 | $63,021 | $31,378 | $31,644 |
| 2022 | $1,728 | $53,713 | $26,142 | $27,571 |
| 2021 | $1,601 | $48,636 | $20,752 | $27,884 |
| 2020 | $1,504 | $48,804 | $20,482 | $28,322 |
| 2019 | $1,434 | $46,177 | $18,442 | $27,735 |
| 2018 | $1,367 | $39,843 | $12,551 | $27,292 |
| 2017 | $1,312 | $38,724 | $11,704 | $27,020 |
| 2016 | $1,279 | $37,312 | $9,702 | $27,610 |
| 2015 | $1,277 | $37,600 | $9,625 | $27,975 |
| 2014 | $1,238 | $33,867 | $6,853 | $27,014 |
| 2013 | -- | $32,711 | $5,929 | $26,782 |
Source: Public Records
Map
Nearby Homes
- 4071 Snowshoe Ln
- 4066 Snowshoe Ln
- 4318 Leeward Ln
- 4120 Vivian Ct
- 4550 Noche Ln
- 4491 Creekside Cir
- 56 Lucky Ln
- 4405 Mesa Grande Ct
- 4400 Alexander Lake Rd
- 65 Lucky Ln
- 4550 Rio Poco Rd
- 4580 Matich Dr Unit 92
- 4577 Reggie Rd Unit 22
- 4593 Reggie Rd
- 320 Lucky Ln
- 4604 Rio Poco Rd
- 4634 Rio Poco Rd Unit 68
- 4769 Reggie Rd Unit 254
- 4702 Rio Poco Rd
- 4777 Reggie Rd Unit 255
- 4069 Leeward Ct
- 4073 Leeward Ct
- 4073 Leeward Ct Unit NV
- 4070 Snowshoe Ln Unit 1
- 4072 Snowshoe Ln
- 4068 Snowshoe Ln
- 4314 Leeward Ln
- 4074 Snowshoe Ln Unit N
- 4074 Snowshoe Ln
- 4320 Leeward Ln
- 4324 Leeward Ln
- 4075 Leeward Ct
- 4076 Snowshoe Ln Unit 1
- 4064 Snowshoe Ln
- 4312 Leeward Ln Unit 1
- 4076 Leeward Ct Unit 1
- 4062 Snowshoe Ln
- 4328 Leeward Ln
- 4074 Leeward Ct
- 4080 Snowshoe Ln