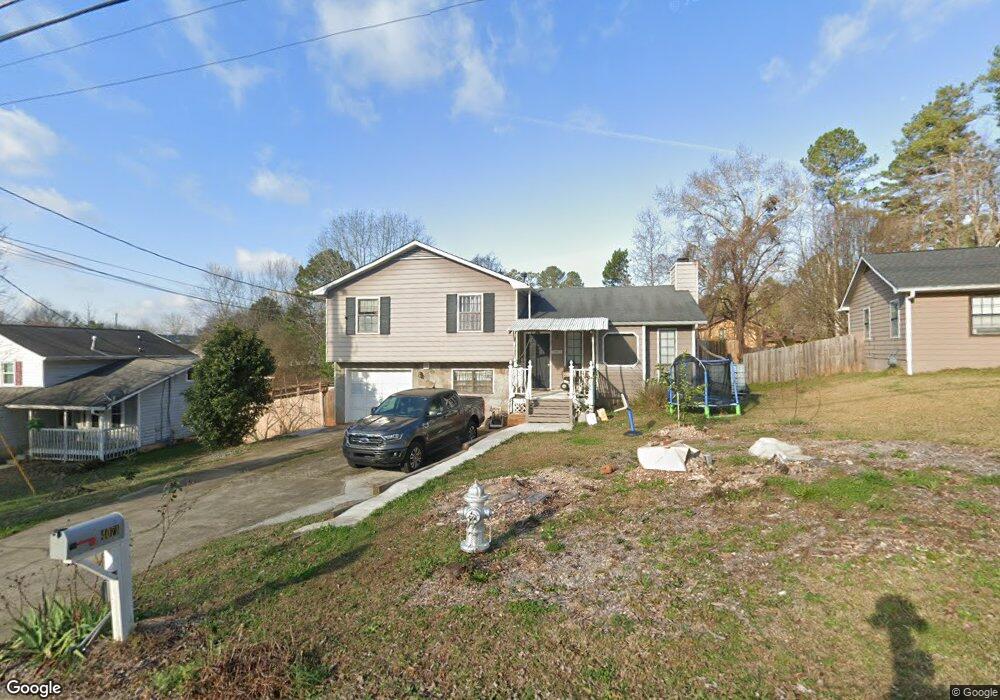
4071 Megan Rd Duluth, GA 30096
Estimated Value: $317,000 - $353,004
3
Beds
2
Baths
1,464
Sq Ft
$226/Sq Ft
Est. Value
About This Home
This home is located at 4071 Megan Rd, Duluth, GA 30096 and is currently estimated at $331,001, approximately $226 per square foot. 4071 Megan Rd is a home located in Gwinnett County with nearby schools including Charles Brant Chesney Elementary School, Duluth Middle School, and Duluth High School.
Ownership History
Date
Name
Owned For
Owner Type
Purchase Details
Closed on
May 30, 2025
Sold by
Zhen Pei Z
Bought by
Juarez Isidro
Current Estimated Value
Home Financials for this Owner
Home Financials are based on the most recent Mortgage that was taken out on this home.
Original Mortgage
$289,987
Outstanding Balance
$288,727
Interest Rate
6.76%
Mortgage Type
New Conventional
Estimated Equity
$42,274
Purchase Details
Closed on
Mar 12, 2008
Sold by
Zhen Pei Z
Bought by
Zhen Pei Z and Yu Jian
Home Financials for this Owner
Home Financials are based on the most recent Mortgage that was taken out on this home.
Original Mortgage
$102,400
Interest Rate
5.62%
Mortgage Type
New Conventional
Purchase Details
Closed on
Mar 11, 2008
Sold by
Willis Oil
Bought by
Quresh Mohammad S
Home Financials for this Owner
Home Financials are based on the most recent Mortgage that was taken out on this home.
Original Mortgage
$102,400
Interest Rate
5.62%
Mortgage Type
New Conventional
Purchase Details
Closed on
May 10, 2007
Sold by
Us Bank Na
Bought by
Ali Muhammad J
Purchase Details
Closed on
Feb 1, 2007
Sold by
Spain Elizabeth M
Bought by
Us Bank Na
Create a Home Valuation Report for This Property
The Home Valuation Report is an in-depth analysis detailing your home's value as well as a comparison with similar homes in the area
Home Values in the Area
Average Home Value in this Area
Purchase History
| Date | Buyer | Sale Price | Title Company |
|---|---|---|---|
| Juarez Isidro | $300,000 | -- | |
| Zhen Pei Z | $128,000 | -- | |
| Zhen Pei Z | $128,000 | -- | |
| Ali Muhammad J | -- | -- | |
| Quresh Mohammad S | -- | -- | |
| Ali Muhammad J | $123,000 | -- | |
| Us Bank Na | $134,567 | -- |
Source: Public Records
Mortgage History
| Date | Status | Borrower | Loan Amount |
|---|---|---|---|
| Open | Juarez Isidro | $289,987 | |
| Previous Owner | Ali Muhammad J | $102,400 |
Source: Public Records
Tax History
| Year | Tax Paid | Tax Assessment Tax Assessment Total Assessment is a certain percentage of the fair market value that is determined by local assessors to be the total taxable value of land and additions on the property. | Land | Improvement |
|---|---|---|---|---|
| 2025 | $5,363 | $142,480 | $27,880 | $114,600 |
| 2024 | $3,458 | $119,640 | $24,000 | $95,640 |
| 2023 | $3,458 | $121,320 | $24,000 | $97,320 |
| 2022 | $3,277 | $112,840 | $22,000 | $90,840 |
| 2021 | $2,730 | $84,600 | $18,000 | $66,600 |
| 2020 | $2,528 | $74,400 | $16,000 | $58,400 |
| 2019 | $2,365 | $70,080 | $16,000 | $54,080 |
| 2018 | $2,143 | $59,960 | $14,000 | $45,960 |
| 2016 | $1,822 | $48,640 | $10,400 | $38,240 |
| 2015 | $1,408 | $36,920 | $8,000 | $28,920 |
| 2014 | -- | $36,920 | $8,000 | $28,920 |
Source: Public Records
Map
Nearby Homes
- 4110 Megan Rd Unit 2
- 4128 Buckingham Place
- 3945 Genoa Ct
- 4300 Wildridge Dr
- 2632 Castlerock Dr
- 4091 Beaver Oaks Dr
- 2852 Inverloch Cir
- 4328 Buckingham Place
- 4166 Howell Park Rd
- 4240 Berkeley Mill Ln
- 4270 Berkeley Mill Ln
- 3980 Howell Park Rd
- 4088 Howell Park Rd Unit 114
- 2347 Fawn Hollow Ct Unit 1
- 2935 Landington Way
- 2925 Landington Way
- 4001 Howell Park Rd
- 2535 Rhoanoke Dr
- 4242 Trail
- 4569 Iroquois Trail
- 4081 Megan Rd
- 4061 Megan Rd
- 4101 Megan Rd Unit 2
- 2610 Gravitt Rd
- 4051 Megan Rd
- 2614 Gravitt Rd
- 2602 Gravitt Rd
- 4070 Megan Rd Unit 2
- 4041 Megan Rd
- 4111 Megan Rd
- 4050 Megan Rd
- 2598 Gravitt Rd
- 4121 Megan Rd Unit 2
- 4080 Megan Rd
- 4100 Megan Rd Unit 2
- 4090 Megan Rd
- 4031 Megan Rd Unit 2
- 4120 Megan Rd
- 4030 Megan Rd
- 4101 Gravitt Place Unit 1
Your Personal Tour Guide
Ask me questions while you tour the home.