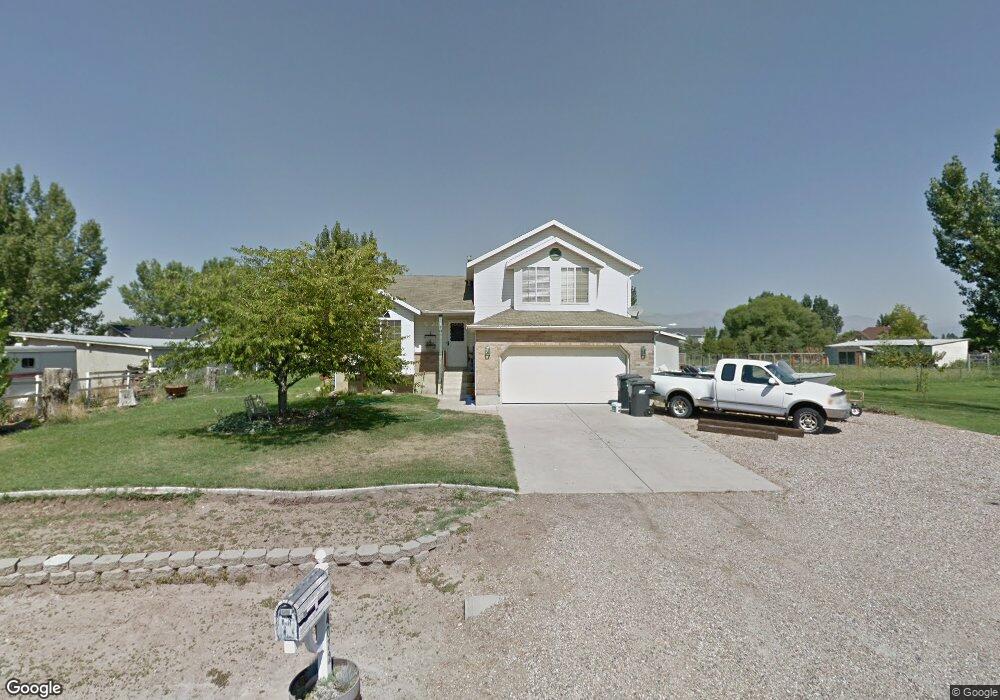
4072 W 3900 S West Haven, UT 84401
Estimated Value: $608,000 - $651,856
4
Beds
4
Baths
2,392
Sq Ft
$261/Sq Ft
Est. Value
About This Home
This home is located at 4072 W 3900 S, West Haven, UT 84401 and is currently estimated at $623,214, approximately $260 per square foot. 4072 W 3900 S is a home located in Weber County with nearby schools including Country View School, Rocky Mountain Junior High School, and Fremont High School.
Ownership History
Date
Name
Owned For
Owner Type
Purchase Details
Closed on
Feb 25, 2020
Sold by
Byrd Weston
Bought by
Watkins Kimberly Ann and Watkins Benjamin David
Current Estimated Value
Home Financials for this Owner
Home Financials are based on the most recent Mortgage that was taken out on this home.
Original Mortgage
$363,298
Outstanding Balance
$322,360
Interest Rate
3.6%
Mortgage Type
FHA
Estimated Equity
$300,854
Purchase Details
Closed on
Mar 10, 2017
Sold by
Vanvantress Lorre Van and Tress Lorrie Van
Bought by
Byrd Weston
Home Financials for this Owner
Home Financials are based on the most recent Mortgage that was taken out on this home.
Original Mortgage
$254,900
Interest Rate
4.19%
Mortgage Type
VA
Purchase Details
Closed on
Sep 22, 2003
Sold by
Strayhorn Trent and Strayhorn Leslie
Bought by
Vantress Lorrie
Create a Home Valuation Report for This Property
The Home Valuation Report is an in-depth analysis detailing your home's value as well as a comparison with similar homes in the area
Home Values in the Area
Average Home Value in this Area
Purchase History
| Date | Buyer | Sale Price | Title Company |
|---|---|---|---|
| Watkins Kimberly Ann | -- | Metro National Title | |
| Byrd Weston | -- | Inwest Title Services | |
| Vantress Lorrie | -- | Mountain View Title |
Source: Public Records
Mortgage History
| Date | Status | Borrower | Loan Amount |
|---|---|---|---|
| Open | Watkins Kimberly Ann | $363,298 | |
| Previous Owner | Byrd Weston | $254,900 |
Source: Public Records
Tax History Compared to Growth
Tax History
| Year | Tax Paid | Tax Assessment Tax Assessment Total Assessment is a certain percentage of the fair market value that is determined by local assessors to be the total taxable value of land and additions on the property. | Land | Improvement |
|---|---|---|---|---|
| 2025 | $3,879 | $559,359 | $175,640 | $383,719 |
| 2024 | $3,681 | $302,500 | $96,602 | $205,898 |
| 2023 | $3,788 | $318,450 | $96,873 | $221,577 |
| 2022 | $3,473 | $295,715 | $96,873 | $198,842 |
| 2021 | $2,966 | $415,000 | $90,628 | $324,372 |
| 2020 | $2,848 | $375,000 | $75,359 | $299,641 |
| 2019 | $414 | $343,000 | $71,868 | $271,132 |
| 2018 | $357 | $323,000 | $71,868 | $251,132 |
| 2017 | $339 | $258,000 | $73,393 | $184,607 |
| 2016 | $2,140 | $139,033 | $29,504 | $109,529 |
| 2015 | $1,817 | $114,692 | $26,769 | $87,923 |
| 2014 | $1,787 | $112,107 | $34,982 | $77,125 |
Source: Public Records
Map
Nearby Homes
- 3984 W 4000 S
- 3941 S 3850 W
- 3795 S 4250 W Unit D
- 3791 S 3750 W
- 3724 S 3650 W
- 4045 S 3600 W
- 3880 S 4550 W
- 4521 W 3950 S Unit 5
- 1636 S 4350 W Unit 217
- 1624 S 4350 W Unit 216
- 3535 S 4300 W
- 4381 W 3550 S
- 3555 W 3900 S
- 4464 W 3600 S
- 3495 S 4250 W
- Altamont Plan at Green Farm - Fields
- Charleston Plan at Green Farm - Fields
- 3554 W 4100 S Unit 63
- 3695 S 3525 W
- 4124 S 3560 W
- 3874 White Rail Ln
- 4061 W 3900 S
- 4048 W 3900 S
- 4085 W 3900 S
- 4085 W 3900 S
- 3914 White Rail Ln
- 3844 White Rail Ln
- 3865 White Rail Ln
- 4037 W 3900 S
- 3883 White Rail Ln
- 3849 S 4025 W
- 3886 S 4025 W
- 3864 S 4025 W
- 3903 White Rail Ln
- 3841 White Rail Ln
- 4015 W 3900 S
- 3405 S 2400 W
- 3405 S 2400 W
- 3846 S 4025 W
- 3921 White Rail Ln