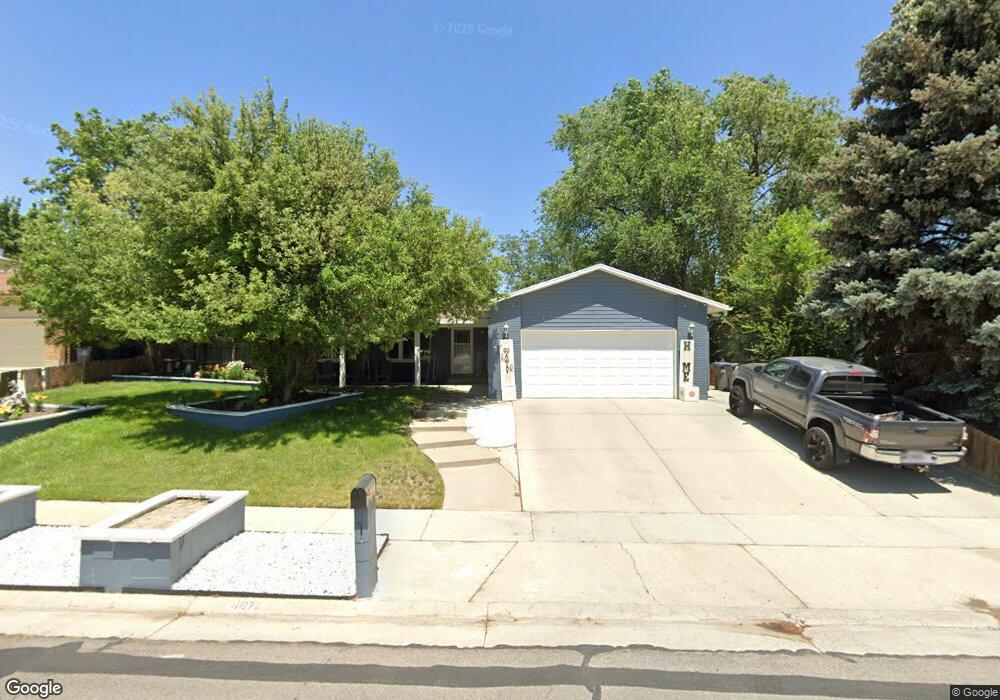
4072 Yorkshire Dr South Jordan, UT 84095
Glenmoor Country Estates NeighborhoodEstimated Value: $562,000 - $626,000
4
Beds
3
Baths
2,960
Sq Ft
$198/Sq Ft
Est. Value
About This Home
This home is located at 4072 Yorkshire Dr, South Jordan, UT 84095 and is currently estimated at $585,207, approximately $197 per square foot. 4072 Yorkshire Dr is a home located in Salt Lake County with nearby schools including Welby Elementary School, Elk Ridge Middle School, and Itineris Early College High School.
Ownership History
Date
Name
Owned For
Owner Type
Purchase Details
Closed on
Oct 30, 2003
Sold by
Velasquez Jim F and Velasquez Sheree
Bought by
Schipper Randy and Schipper Spring
Current Estimated Value
Home Financials for this Owner
Home Financials are based on the most recent Mortgage that was taken out on this home.
Original Mortgage
$126,875
Outstanding Balance
$58,574
Interest Rate
5.94%
Mortgage Type
FHA
Estimated Equity
$526,633
Purchase Details
Closed on
Jun 22, 1998
Sold by
Vogel Thomas and Vogel Ruth L
Bought by
Velasquez Jim F and Velasquez Sheree
Home Financials for this Owner
Home Financials are based on the most recent Mortgage that was taken out on this home.
Original Mortgage
$120,000
Interest Rate
7.11%
Create a Home Valuation Report for This Property
The Home Valuation Report is an in-depth analysis detailing your home's value as well as a comparison with similar homes in the area
Home Values in the Area
Average Home Value in this Area
Purchase History
| Date | Buyer | Sale Price | Title Company |
|---|---|---|---|
| Schipper Randy | -- | Surety Title | |
| Velasquez Jim F | -- | -- |
Source: Public Records
Mortgage History
| Date | Status | Borrower | Loan Amount |
|---|---|---|---|
| Open | Schipper Randy | $126,875 | |
| Previous Owner | Velasquez Jim F | $120,000 |
Source: Public Records
Tax History Compared to Growth
Tax History
| Year | Tax Paid | Tax Assessment Tax Assessment Total Assessment is a certain percentage of the fair market value that is determined by local assessors to be the total taxable value of land and additions on the property. | Land | Improvement |
|---|---|---|---|---|
| 2025 | $2,812 | $543,200 | $148,400 | $394,800 |
| 2024 | $2,812 | $533,900 | $145,600 | $388,300 |
| 2023 | $2,974 | $532,700 | $141,400 | $391,300 |
| 2022 | $3,035 | $532,900 | $138,600 | $394,300 |
| 2021 | $2,327 | $374,800 | $108,000 | $266,800 |
| 2020 | $2,314 | $349,400 | $108,000 | $241,400 |
| 2019 | $2,082 | $335,400 | $101,900 | $233,500 |
| 2018 | $0 | $286,700 | $101,900 | $184,800 |
| 2017 | $1,843 | $266,700 | $101,900 | $164,800 |
| 2016 | $1,853 | $254,100 | $101,900 | $152,200 |
| 2015 | $1,820 | $242,700 | $103,800 | $138,900 |
| 2014 | $1,746 | $228,800 | $99,000 | $129,800 |
Source: Public Records
Map
Nearby Homes
- 9375 S Laurel Ridge Cir
- 9941 Birnam Woods Way
- 4424 W Skye Dr
- 3702 W Angus Dr
- 9851 S Birdie Way
- 9441 S Newkirk St
- 9566 Ember Glow Ct Unit C
- 9526 Ember Glow Ct Unit C
- 9353 S 4460 W
- 3750 W Bingham Creek Dr
- 4072 W Ascot Downs Dr
- 4058 W Ascot Downs Dr
- 4565 Lennox Dr
- 3928 W Kilt St
- 4246 W Ascot Downs Dr
- 4554 Birdie Way
- 10164 Birnam Woods Way
- 4208 W Chestnut View Dr
- 8983 S 3860 W
- Raddison Plan at Eagles Landing
- 4072 W Yorkshire Dr
- 4084 W Yorkshire Dr
- 4060 Yorkshire Dr
- 4084 Yorkshire Dr
- 4077 W 9580 S
- 4061 W 9580 S
- 4096 W Yorkshire Dr
- 4048 Yorkshire Dr
- 4096 Yorkshire Dr
- 4048 W Yorkshire Dr
- 4063 Yorkshire Dr
- 4089 W 9580 S
- 4089 Yorkshire Dr
- 4047 W 9580 S
- 4036 Yorkshire Dr
- 4108 Yorkshire Dr
- 9646 Stonehaven St
- 9646 S Stonehaven St
- 9649 Stonehaven St
- 4111 W 9580 S