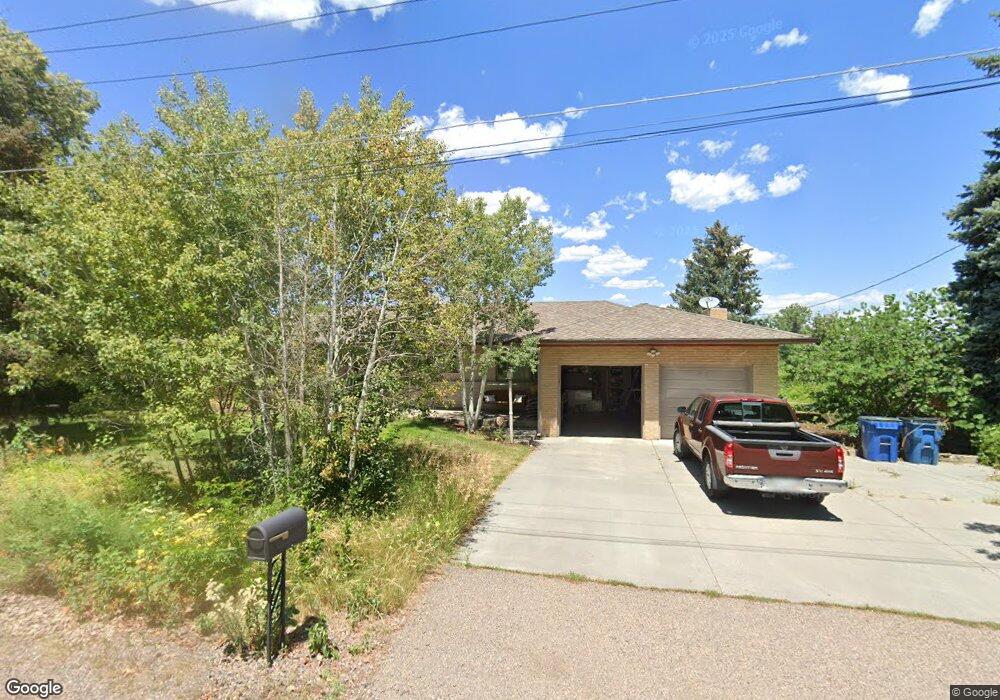
4075 Holland St Wheat Ridge, CO 80033
Bel Aire NeighborhoodEstimated Value: $804,000 - $946,349
3
Beds
3
Baths
2,112
Sq Ft
$407/Sq Ft
Est. Value
About This Home
This home is located at 4075 Holland St, Wheat Ridge, CO 80033 and is currently estimated at $860,337, approximately $407 per square foot. 4075 Holland St is a home located in Jefferson County with nearby schools including Stevens Elementary School, Everitt Middle School, and Wheat Ridge High School.
Ownership History
Date
Name
Owned For
Owner Type
Purchase Details
Closed on
May 5, 2020
Sold by
Wendeborn Wanda Jeanell
Bought by
Tieszen Christopher
Current Estimated Value
Home Financials for this Owner
Home Financials are based on the most recent Mortgage that was taken out on this home.
Original Mortgage
$585,000
Outstanding Balance
$499,680
Interest Rate
3.6%
Mortgage Type
Credit Line Revolving
Estimated Equity
$360,657
Purchase Details
Closed on
Feb 9, 2016
Sold by
Wendeborn Fred W
Bought by
Wendeborn Wanda Jeanell
Purchase Details
Closed on
May 12, 2000
Sold by
Wendeborn Wanda Jeanell
Bought by
Wendeborn Wanda Jeanell and Wendeborn Fred W
Purchase Details
Closed on
Oct 28, 1999
Sold by
Jeanell B Ondrusek & Mary Anne Novak Tr
Bought by
Wendeborn Fred W and Wendeborn Wanda Jeanell
Purchase Details
Closed on
Sep 6, 1994
Sold by
Ondrusek Richard J
Bought by
Ondrusek Jeanell B
Create a Home Valuation Report for This Property
The Home Valuation Report is an in-depth analysis detailing your home's value as well as a comparison with similar homes in the area
Home Values in the Area
Average Home Value in this Area
Purchase History
| Date | Buyer | Sale Price | Title Company |
|---|---|---|---|
| Tieszen Christopher | $585,000 | Prestige Title & Escrow Llc | |
| Wendeborn Wanda Jeanell | $83,980 | None Available | |
| Wendeborn Wanda Jeanell | $79,715 | -- | |
| Wendeborn Fred W | $79,715 | -- | |
| Ondrusek Jeanell B | -- | -- |
Source: Public Records
Mortgage History
| Date | Status | Borrower | Loan Amount |
|---|---|---|---|
| Open | Tieszen Christopher | $585,000 |
Source: Public Records
Tax History Compared to Growth
Tax History
| Year | Tax Paid | Tax Assessment Tax Assessment Total Assessment is a certain percentage of the fair market value that is determined by local assessors to be the total taxable value of land and additions on the property. | Land | Improvement |
|---|---|---|---|---|
| 2024 | $5,256 | $55,228 | $32,137 | $23,091 |
| 2023 | $5,256 | $55,228 | $32,137 | $23,091 |
| 2022 | $4,102 | $42,409 | $22,837 | $19,572 |
| 2021 | $4,164 | $43,630 | $23,494 | $20,136 |
| 2020 | $3,112 | $39,916 | $22,627 | $17,289 |
| 2019 | $3,074 | $39,916 | $22,627 | $17,289 |
| 2018 | $2,796 | $36,093 | $15,419 | $20,674 |
| 2017 | $2,545 | $36,093 | $15,419 | $20,674 |
| 2016 | $2,045 | $29,825 | $10,984 | $18,841 |
| 2015 | $1,616 | $29,825 | $10,984 | $18,841 |
| 2014 | $1,616 | $24,258 | $8,227 | $16,031 |
Source: Public Records
Map
Nearby Homes
- 3865 Independence Ct
- 4229 Garrison St
- 3725 Holland St
- 8888 W 37th Place
- 9800 W 38th Ave
- 3860 Dudley St
- 3795 Dudley St
- 3540 Everett St
- 10095 W 41st Ave
- 10169 W 38th Ave
- 10163 W 38th Ave
- 10151 W 38th Ave
- 10187 W 38th Ave
- 10095 W 35th Ave
- 8391 W 38th Ave
- 10005 W 34th Ave
- 8805 W 46th Ave
- 4290 Carr St
- 3840 Brentwood St
- 4607 Independence St
- 4015 Holland St
- 3995 Garland St
- 3955 Garland St
- 4000 Holland St
- 3998 Garrison St
- 4005 Holland St
- 3935 Garland St
- 3990 Garland St
- 3980 Garland St
- 3995 Holland St
- 3920 Holland St
- 3915 Garland St
- 3980 Garrison St
- 3940 Garland St
- 3975 Holland St
- 3905 Garland St
- 3920 Garland St
- 3900 Holland St
- 3961 Garrison St
- 3900 Hoyt St