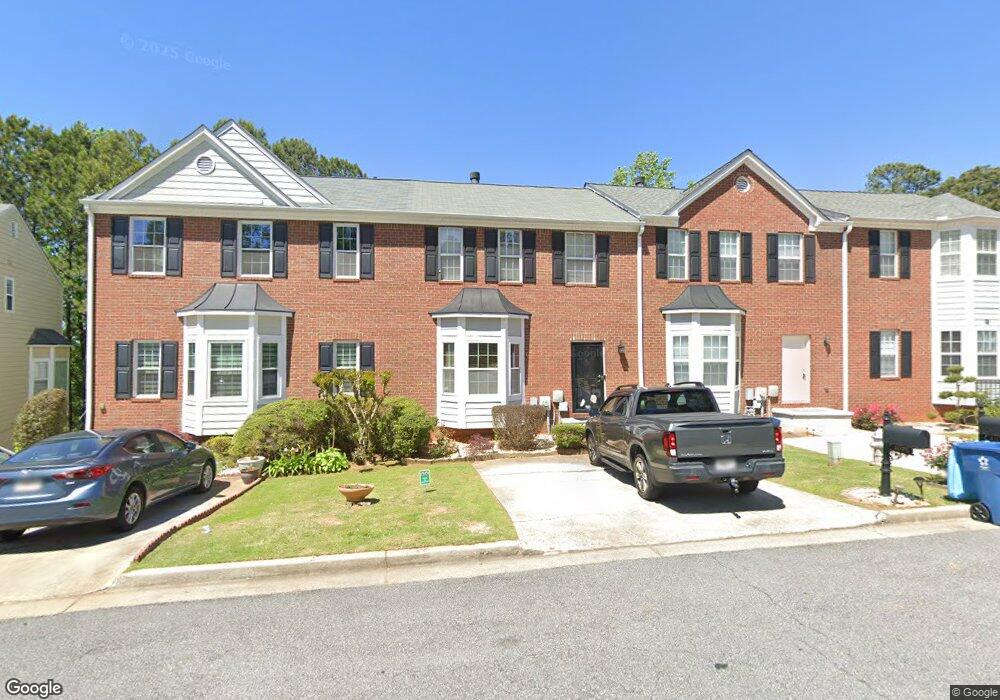
4075 Spring Cove Dr Duluth, GA 30097
Estimated Value: $309,000 - $370,578
2
Beds
3
Baths
1,704
Sq Ft
$202/Sq Ft
Est. Value
About This Home
This home is located at 4075 Spring Cove Dr, Duluth, GA 30097 and is currently estimated at $344,395, approximately $202 per square foot. 4075 Spring Cove Dr is a home located in Gwinnett County with nearby schools including Chattahoochee Elementary School, Coleman Middle School, and Duluth High School.
Ownership History
Date
Name
Owned For
Owner Type
Purchase Details
Closed on
Jan 29, 2022
Sold by
Te Sereyratanak
Bought by
Te Sereyratanak and Kim Chanreaksmey
Current Estimated Value
Purchase Details
Closed on
May 2, 2014
Sold by
Gardner Brian J
Bought by
Te Sereyratanak
Home Financials for this Owner
Home Financials are based on the most recent Mortgage that was taken out on this home.
Original Mortgage
$118,316
Interest Rate
3.75%
Mortgage Type
FHA
Purchase Details
Closed on
Jul 17, 1998
Sold by
Homeland Communities Inc
Bought by
Gardner Brian J and Gardner James D
Home Financials for this Owner
Home Financials are based on the most recent Mortgage that was taken out on this home.
Original Mortgage
$86,193
Interest Rate
7.02%
Mortgage Type
New Conventional
Create a Home Valuation Report for This Property
The Home Valuation Report is an in-depth analysis detailing your home's value as well as a comparison with similar homes in the area
Home Values in the Area
Average Home Value in this Area
Purchase History
| Date | Buyer | Sale Price | Title Company |
|---|---|---|---|
| Te Sereyratanak | -- | -- | |
| Te Sereyratanak | $120,500 | -- | |
| Gardner Brian J | $115,000 | -- |
Source: Public Records
Mortgage History
| Date | Status | Borrower | Loan Amount |
|---|---|---|---|
| Previous Owner | Te Sereyratanak | $118,316 | |
| Previous Owner | Gardner Brian J | $86,193 |
Source: Public Records
Tax History
| Year | Tax Paid | Tax Assessment Tax Assessment Total Assessment is a certain percentage of the fair market value that is determined by local assessors to be the total taxable value of land and additions on the property. | Land | Improvement |
|---|---|---|---|---|
| 2025 | $1,044 | $170,160 | $18,040 | $152,120 |
| 2024 | $4,094 | $154,520 | $16,000 | $138,520 |
| 2023 | $4,094 | $145,960 | $16,000 | $129,960 |
| 2022 | $3,615 | $130,560 | $16,000 | $114,560 |
| 2021 | $3,171 | $96,680 | $11,600 | $85,080 |
| 2020 | $2,973 | $89,960 | $11,600 | $78,360 |
| 2019 | $3,585 | $89,960 | $11,600 | $78,360 |
| 2018 | $2,535 | $76,560 | $11,600 | $64,960 |
| 2016 | $2,051 | $62,040 | $11,600 | $50,440 |
| 2015 | $1,919 | $48,200 | $8,800 | $39,400 |
| 2014 | -- | $50,520 | $8,800 | $41,720 |
Source: Public Records
Map
Nearby Homes
- 4074 Spring Cove Dr
- 4054 Spring Cove Dr
- 2491 Valley Cove Dr
- 2553 Summit Cove Dr Unit 130
- 4005 Spring Cove Dr
- 4245 Prince Charles Dr
- 4220 Cavalier Way
- 4105 Cavalier Way
- 4044 Bennigan Ln Unit 3
- 4734 Dewitt Dr
- 2765 Olde Towne Pkwy
- 3955 Longlake Dr
- 2870 Towne Village Dr NW
- 2711 Old Coach Rd
- 4054 Towne Creek Cove
- 2345 Hiawassee Dr
- 1975 Chattahoochee Dr
- 4193 Halton Rd
- 2956 Chene Place
- 2643 Timberbrooke Place
- 4075 Spring Cove Dr Unit 4073
- 4075 Spring Cove Dr Unit 57
- 4075 Spring Cove Dr Unit 4075
- 4071 Spring Cove Dr
- 4079 Spring Cove Dr
- 4069 Spring Cove Dr
- 4081 Spring Cove Dr
- 4065 Spring Cove Dr Unit 60
- 4065 Spring Cove Dr Unit II
- 4085 Spring Cove Dr
- 4061 Spring Cove Dr
- 4089 Spring Cove Dr
- 4070 Spring Cove Dr Unit 4070
- 4070 Spring Cove Dr
- 4058 Spring Cove Dr
- 2426 Valley Cove Dr Unit 38
- 4091 Spring Cove Dr
- 4059 Spring Cove Dr
- 4078 Spring Cove Dr Unit 94
- 4050 Spring Cove Dr
Your Personal Tour Guide
Ask me questions while you tour the home.