4075 State Highway 339 Unit Tr. 1A-A111,Tr. 1A-1 Young Harris, GA 30582
--
Bed
--
Bath
1,440
Sq Ft
3,920
Sq Ft Lot
About This Home
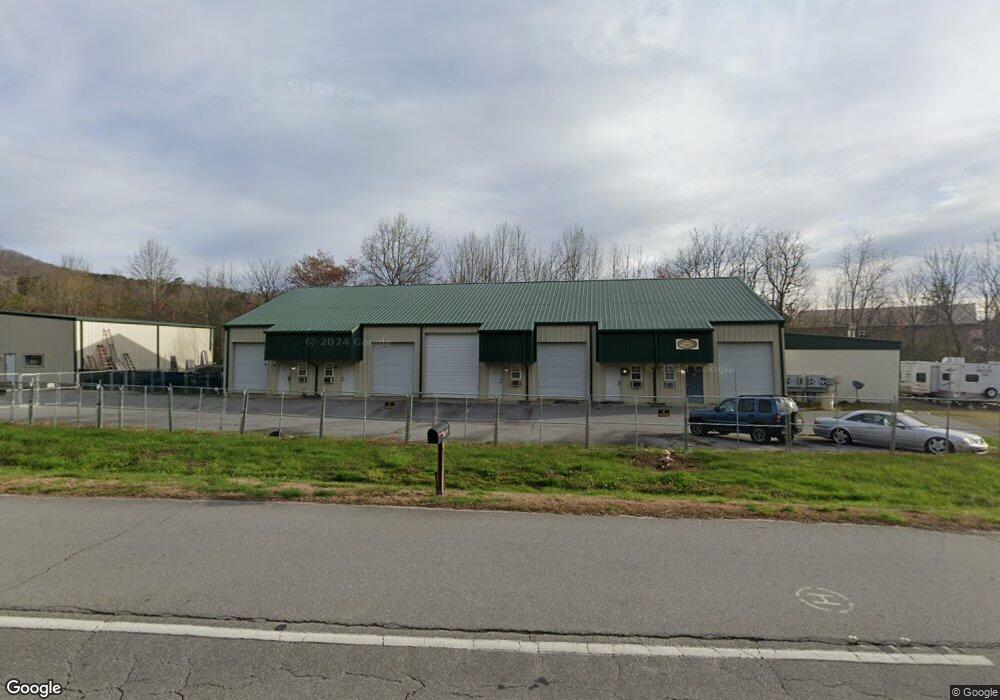
This home is located at 4075 State Highway 339 Unit Tr. 1A-A111,Tr. 1A-1, Young Harris, GA 30582. 4075 State Highway 339 Unit Tr. 1A-A111,Tr. 1A-1 is a home located in Towns County with nearby schools including Towns County Elementary School, Towns County Middle School, and Towns County High School.
Ownership History
Date
Name
Owned For
Owner Type
Purchase Details
Closed on
Jan 28, 2021
Sold by
Puett Edwin E
Bought by
Lin Carol
Purchase Details
Closed on
May 27, 2015
Sold by
Mantovani Kenneth J
Bought by
Hunnicutt Christopher J
Home Financials for this Owner
Home Financials are based on the most recent Mortgage that was taken out on this home.
Original Mortgage
$116,000
Interest Rate
3.95%
Mortgage Type
New Conventional
Purchase Details
Closed on
Apr 10, 2015
Sold by
Mantovani Kenneth J
Bought by
Puett Edwin E
Home Financials for this Owner
Home Financials are based on the most recent Mortgage that was taken out on this home.
Original Mortgage
$116,000
Interest Rate
3.95%
Mortgage Type
New Conventional
Purchase Details
Closed on
Oct 23, 2014
Sold by
Didon Enterprises Inc
Bought by
Mantovani Kenneth J
Purchase Details
Closed on
Oct 20, 2004
Sold by
Town Centre Development
Bought by
Town Centre Development&
Purchase Details
Closed on
Feb 5, 2003
Sold by
Towns County Industrial
Bought by
Town Centre Development
Create a Home Valuation Report for This Property
The Home Valuation Report is an in-depth analysis detailing your home's value as well as a comparison with similar homes in the area
Home Values in the Area
Average Home Value in this Area
Purchase History
| Date | Buyer | Sale Price | Title Company |
|---|---|---|---|
| Lin Carol | $140,000 | -- | |
| Hunnicutt Christopher J | -- | -- | |
| Puett Edwin E | $130,000 | -- | |
| Mantovani Kenneth J | $40,000 | -- | |
| Town Centre Development& | $180,000 | -- | |
| Town Centre Development | $125,000 | -- |
Source: Public Records
Mortgage History
| Date | Status | Borrower | Loan Amount |
|---|---|---|---|
| Previous Owner | Puett Edwin E | $116,000 |
Source: Public Records
Tax History Compared to Growth
Tax History
| Year | Tax Paid | Tax Assessment Tax Assessment Total Assessment is a certain percentage of the fair market value that is determined by local assessors to be the total taxable value of land and additions on the property. | Land | Improvement |
|---|---|---|---|---|
| 2024 | $309 | $28,807 | $2,700 | $26,107 |
| 2023 | $283 | $28,732 | $1,440 | $27,292 |
| 2022 | $283 | $26,557 | $1,440 | $25,117 |
| 2021 | $308 | $25,563 | $6,000 | $19,563 |
| 2020 | $301 | $23,504 | $6,000 | $17,504 |
| 2019 | $306 | $23,504 | $6,000 | $17,504 |
| 2018 | $314 | $23,504 | $6,000 | $17,504 |
| 2017 | $325 | $23,504 | $6,000 | $17,504 |
| 2016 | $325 | $23,504 | $6,000 | $17,504 |
| 2015 | $484 | $34,538 | $6,000 | $28,538 |
| 2014 | -- | $40,046 | $6,000 | $34,046 |
| 2013 | -- | $44,046 | $10,000 | $34,046 |
Source: Public Records
Map
Nearby Homes
- 2378 Bellview Ln
- 3777 N Meadow Cir
- 124 Meadow Brooke Dr
- 64 Meadow Brooke Dr
- lot 25 Meadow Brooke Dr
- Lot 42 Meadow Brooke Dr
- LT 26 Meadow Brooke Dr
- Lot 41 Meadow Brooke Dr
- 105 Meadow Brooke Dr
- LL 14 Coffey Ln
- 2373 Herman Drake Rd
- Lot 2 Coffey Ln
- LL14LT1 Coffey Ln
- 3259 Coffey Ln
- 2515 Leisure Ln
- LOTS 1-4 Windy Ridge & Hwy 69
- Lots 1-4 Windy Ridge Terrace & Hwy 69
- 3251 Holland Dr
- 0 Harris Ridge Rd Unit 27 10513683
- 1688 Lakeview Drive 1a Dr
- 4077 State Highway 339
- 4070 State Highway 339
- 3995 State Highway 339
- 3995 Georgia 339
- 2489 State Highway 17
- 2489 State Highway 17
- 4075 Georgia 339 Unit TR. 1A-A111,TR. 1A-1
- 5011 Industrial Park Dr
- 2489 State Hwy 17n
- 2209 Bellview Ln
- 2414 Tatham Ridge
- 0 Tatham Ridge
- .898 Acres State Hwy 17
- 2261 Bellview Ln
- 0 Woods Grove Rd Unit 12E 8021437
- 0 Woods Grove Rd Unit 11E 8021434
- 0 Woods Grove Rd Unit 3153094
- 2512 Dockery St
- 2558 Dockery St
- 0 Bell View Ln Unit 8050857