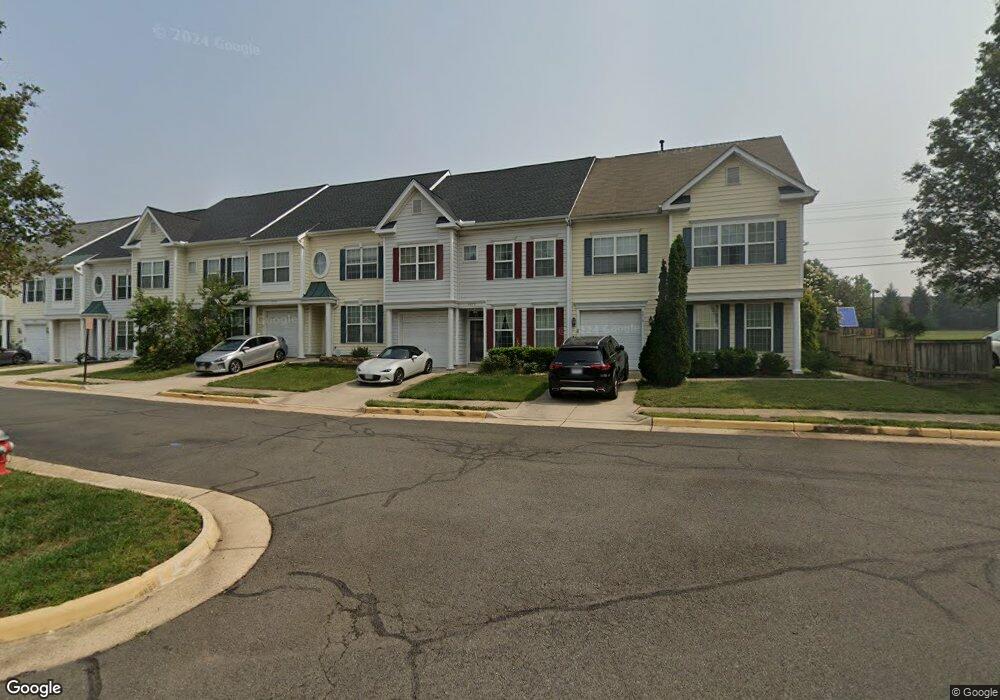
4076 Britwell Place Fairfax, VA 22033
Estimated Value: $522,000 - $710,000
3
Beds
3
Baths
2,437
Sq Ft
$261/Sq Ft
Est. Value
About This Home
This home is located at 4076 Britwell Place, Fairfax, VA 22033 and is currently estimated at $637,259, approximately $261 per square foot. 4076 Britwell Place is a home located in Fairfax County with nearby schools including Greenbriar East Elementary School, Rocky Run Middle School, and Chantilly High School.
Ownership History
Date
Name
Owned For
Owner Type
Purchase Details
Closed on
Mar 5, 2025
Sold by
Hwang Chang H and Hwang Ku H
Bought by
Hwang Hyung J and Lee Jennifer K
Current Estimated Value
Purchase Details
Closed on
Jul 15, 2015
Sold by
Hwang Ku H
Bought by
Hwang Ku H
Purchase Details
Closed on
Aug 15, 2003
Sold by
Gopalakrish Seethalakshmi
Bought by
Hwang Chang H
Home Financials for this Owner
Home Financials are based on the most recent Mortgage that was taken out on this home.
Original Mortgage
$220,000
Interest Rate
5.46%
Mortgage Type
New Conventional
Purchase Details
Closed on
Nov 30, 1998
Sold by
Stanley Martin Homes L L
Bought by
Lyer Shankar
Home Financials for this Owner
Home Financials are based on the most recent Mortgage that was taken out on this home.
Original Mortgage
$181,450
Interest Rate
6.83%
Create a Home Valuation Report for This Property
The Home Valuation Report is an in-depth analysis detailing your home's value as well as a comparison with similar homes in the area
Home Values in the Area
Average Home Value in this Area
Purchase History
| Date | Buyer | Sale Price | Title Company |
|---|---|---|---|
| Hwang Hyung J | $515,000 | Champion Title & Settlements | |
| Hwang Ku H | -- | -- | |
| Hwang Chang H | $320,125 | -- | |
| Lyer Shankar | $191,000 | -- |
Source: Public Records
Mortgage History
| Date | Status | Borrower | Loan Amount |
|---|---|---|---|
| Previous Owner | Hwang Chang H | $220,000 | |
| Previous Owner | Lyer Shankar | $181,450 |
Source: Public Records
Tax History Compared to Growth
Tax History
| Year | Tax Paid | Tax Assessment Tax Assessment Total Assessment is a certain percentage of the fair market value that is determined by local assessors to be the total taxable value of land and additions on the property. | Land | Improvement |
|---|---|---|---|---|
| 2025 | $6,991 | $647,940 | $185,000 | $462,940 |
| 2024 | $6,991 | $603,420 | $170,000 | $433,420 |
| 2023 | $6,810 | $603,420 | $170,000 | $433,420 |
| 2022 | $6,188 | $541,170 | $140,000 | $401,170 |
| 2021 | $0 | $485,980 | $130,000 | $355,980 |
| 2020 | $6,444 | $484,530 | $130,000 | $354,530 |
| 2019 | $6,403 | $481,410 | $130,000 | $351,410 |
| 2018 | $5,997 | $450,910 | $125,000 | $325,910 |
| 2017 | $0 | $428,790 | $117,000 | $311,790 |
| 2016 | $4,968 | $428,790 | $117,000 | $311,790 |
| 2015 | $2,347 | $420,680 | $115,000 | $305,680 |
| 2014 | -- | $388,320 | $110,000 | $278,320 |
Source: Public Records
Map
Nearby Homes
- 12975 Ridgemist Ln
- 4001 Middle Ridge Dr
- 4107 Mount Echo Ln
- 4111 Mount Echo Ln
- 12798 Fox Keep Run
- 12801 Point Pleasant Dr
- 13116 Penndale Ln
- 13102 Pennypacker Ln
- 3814 Highland Oaks Dr
- 4303 Markwood Ln
- 4403 Moylan Ln
- 4319 Markwood Ln
- 4427 Majestic Ln
- 3925 Fair Ridge Dr Unit 305
- 3925 Fair Ridge Dr Unit 304
- 4204 Trumbo Ct
- 12802 Holly Grove Ct
- 3795 Rainier Dr
- 4506 Superior Square
- 4528 Superior Square
- 4074 Britwell Place
- 4078 Britwell Place
- 4072 Britwell Place
- 4070 Britwell Place
- 4068 Britwell Place
- 4079 Britwell Place
- 4081 Britwell Place
- 4077 Britwell Place
- 4083 Britwell Place
- 4075 Britwell Place
- 4085 Britwell Place
- 4073 Britwell Place
- 4071 Britwell Place
- 4069 Britwell Place
- 4055 Britwell Place
- 4057 Britwell Place
- 4053 Britwell Place
- 4051 Britwell Place
- 4059 Britwell Place
- 12823 Lee Jackson Memorial Hwy