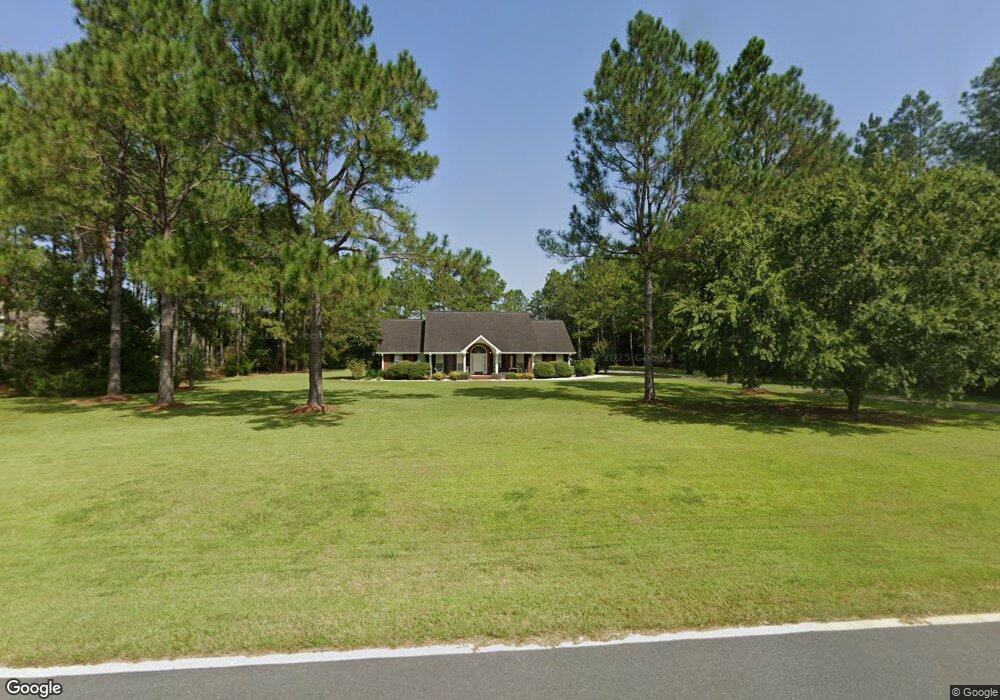
4076 Dereck Ln Patterson, GA 31557
Estimated Value: $318,000 - $364,000
4
Beds
3
Baths
2,207
Sq Ft
$154/Sq Ft
Est. Value
About This Home
This home is located at 4076 Dereck Ln, Patterson, GA 31557 and is currently estimated at $339,456, approximately $153 per square foot. 4076 Dereck Ln is a home located in Pierce County with nearby schools including Pierce County High School and Southeast Christian Academy.
Ownership History
Date
Name
Owned For
Owner Type
Purchase Details
Closed on
Jun 27, 2018
Sold by
Hughes Elaine B
Bought by
Vandergriff Jerry Wayne and Vandergriff Sheri Jo
Current Estimated Value
Home Financials for this Owner
Home Financials are based on the most recent Mortgage that was taken out on this home.
Original Mortgage
$192,350
Outstanding Balance
$113,269
Interest Rate
4.5%
Mortgage Type
New Conventional
Estimated Equity
$226,187
Purchase Details
Closed on
Dec 1, 2011
Sold by
Hughes Judy Elaine Bennett
Bought by
Hughes Judy Elaine Bennett
Purchase Details
Closed on
Jun 24, 2005
Sold by
Strickland James S
Bought by
Hughes Jessie D and Hughes Elaine B
Purchase Details
Closed on
Feb 1, 2001
Sold by
Milton Randy D
Bought by
Strickland James S and Strickland Misty A
Purchase Details
Closed on
Oct 26, 1999
Sold by
Barnard J P
Bought by
Milton Randy D
Purchase Details
Closed on
Aug 22, 1973
Bought by
Barnard J P
Create a Home Valuation Report for This Property
The Home Valuation Report is an in-depth analysis detailing your home's value as well as a comparison with similar homes in the area
Purchase History
| Date | Buyer | Sale Price | Title Company |
|---|---|---|---|
| Vandergriff Jerry Wayne | $213,000 | -- | |
| Hughes Judy Elaine Bennett | -- | -- | |
| Hughes Jessie D | $181,500 | -- | |
| Strickland James S | $160,000 | -- | |
| Milton Randy D | $7,500 | -- | |
| Barnard J P | -- | -- |
Source: Public Records
Mortgage History
| Date | Status | Borrower | Loan Amount |
|---|---|---|---|
| Open | Vandergriff Jerry Wayne | $192,350 |
Source: Public Records
Tax History
| Year | Tax Paid | Tax Assessment Tax Assessment Total Assessment is a certain percentage of the fair market value that is determined by local assessors to be the total taxable value of land and additions on the property. | Land | Improvement |
|---|---|---|---|---|
| 2025 | $2,825 | $125,378 | $15,040 | $110,338 |
| 2024 | $2,765 | $119,436 | $11,280 | $108,156 |
| 2023 | $2,758 | $118,562 | $11,280 | $107,282 |
| 2022 | $2,605 | $84,699 | $4,094 | $80,605 |
| 2021 | $2,747 | $81,396 | $4,094 | $77,302 |
| 2020 | $2,752 | $78,092 | $4,094 | $73,998 |
| 2019 | $2,751 | $78,092 | $4,094 | $73,998 |
| 2018 | $2,312 | $71,946 | $4,094 | $67,852 |
| 2017 | $2,698 | $70,047 | $4,094 | $65,953 |
| 2016 | $2,296 | $70,047 | $4,094 | $65,953 |
| 2015 | $1,621 | $70,046 | $4,094 | $65,953 |
| 2014 | $1,621 | $70,046 | $4,094 | $65,953 |
| 2013 | $1,621 | $70,046 | $4,093 | $65,952 |
Source: Public Records
Map
Nearby Homes
- 5772 Industrial Blvd
- 5661 E Railroad Ave
- 3540 Williams St
- 3501 Martin St
- 5518 W Railroad Ave
- 3442 Wildwood Ave
- 3432 Nellie St
- 3440 Nellie St
- 3285 Tyre Bridge Rd
- 3231 Pear Ave
- 0 Eden Rd
- 5574 Walkerville Rd
- 6193 Offerman Loop
- 5209 Georgia 32
- 5209 Ga Highway 32
- 3587 Cathleen Dr
- 6204 Cross Swamp Rd
- 5817 Cantrell Rd
- 0 Otter Creek Rd Unit 23325273
- 5466 Robin Rd
Your Personal Tour Guide
Ask me questions while you tour the home.