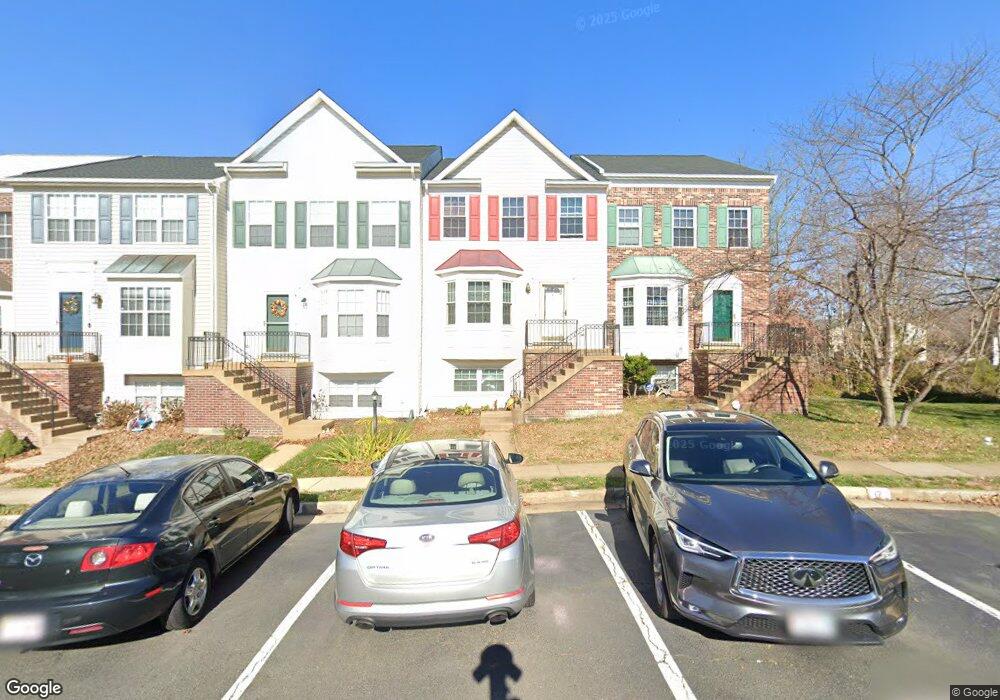
4077 Yellow Stone Loop Dumfries, VA 22025
Estimated Value: $444,614 - $508,000
4
Beds
4
Baths
1,496
Sq Ft
$318/Sq Ft
Est. Value
About This Home
This home is located at 4077 Yellow Stone Loop, Dumfries, VA 22025 and is currently estimated at $476,154, approximately $318 per square foot. 4077 Yellow Stone Loop is a home located in Prince William County with nearby schools including John F. Pattie Sr. Elementary School, Graham Park Middle School, and Forest Park High School.
Ownership History
Date
Name
Owned For
Owner Type
Purchase Details
Closed on
Jul 31, 2009
Sold by
Tibui Linus A
Bought by
Kuffour Jeniifer
Current Estimated Value
Home Financials for this Owner
Home Financials are based on the most recent Mortgage that was taken out on this home.
Original Mortgage
$171,830
Outstanding Balance
$111,450
Interest Rate
5.43%
Mortgage Type
FHA
Estimated Equity
$364,704
Purchase Details
Closed on
Jan 25, 2007
Sold by
Enoh Maurice
Bought by
Tibui Linus A
Home Financials for this Owner
Home Financials are based on the most recent Mortgage that was taken out on this home.
Original Mortgage
$257,600
Interest Rate
6.15%
Mortgage Type
New Conventional
Purchase Details
Closed on
May 25, 1995
Sold by
Washington Homes Inc
Bought by
Cremeans James W
Home Financials for this Owner
Home Financials are based on the most recent Mortgage that was taken out on this home.
Original Mortgage
$121,421
Interest Rate
8.33%
Create a Home Valuation Report for This Property
The Home Valuation Report is an in-depth analysis detailing your home's value as well as a comparison with similar homes in the area
Home Values in the Area
Average Home Value in this Area
Purchase History
| Date | Buyer | Sale Price | Title Company |
|---|---|---|---|
| Kuffour Jeniifer | $175,000 | Stewart Title | |
| Tibui Linus A | $322,000 | -- | |
| Cremeans James W | $121,840 | -- |
Source: Public Records
Mortgage History
| Date | Status | Borrower | Loan Amount |
|---|---|---|---|
| Open | Kuffour Jeniifer | $171,830 | |
| Previous Owner | Tibui Linus A | $257,600 | |
| Previous Owner | Cremeans James W | $121,421 |
Source: Public Records
Tax History
| Year | Tax Paid | Tax Assessment Tax Assessment Total Assessment is a certain percentage of the fair market value that is determined by local assessors to be the total taxable value of land and additions on the property. | Land | Improvement |
|---|---|---|---|---|
| 2025 | $3,882 | $411,300 | $147,400 | $263,900 |
| 2024 | $3,882 | $390,300 | $140,400 | $249,900 |
| 2023 | $3,848 | $369,800 | $132,500 | $237,300 |
| 2022 | $4,054 | $357,400 | $127,400 | $230,000 |
| 2021 | $3,834 | $312,400 | $110,700 | $201,700 |
| 2020 | $4,493 | $289,900 | $102,500 | $187,400 |
| 2019 | $4,280 | $276,100 | $97,700 | $178,400 |
| 2018 | $3,141 | $260,100 | $92,100 | $168,000 |
| 2017 | $3,212 | $258,500 | $91,200 | $167,300 |
| 2016 | $3,165 | $257,100 | $89,400 | $167,700 |
| 2015 | $2,965 | $245,700 | $85,200 | $160,500 |
| 2014 | $2,965 | $235,300 | $81,100 | $154,200 |
Source: Public Records
Map
Nearby Homes
- 17483 Denali Place
- 4124 La Mauricie Loop
- 4072 Presidential Hill Loop
- 17640 Washington St
- 3970 Fairfax St
- 17214 Batestown Rd
- 4145 Bassett Ct
- 22 Prince William Cir
- 104 Prince Charles Ln
- 50 Dumfries Dr
- 17421 Tripoli Blvd
- 4047 White Haven Dr
- 16992 Alicia Ave
- 17914 Dr David Cline Ln
- 17992 Alicia Ave
- 17961 Main St
- 3629 Brockenbrough Dr
- 3624 Briarwood Dr
- 3634 Briarwood Dr
- 2421 Kilpatrick Place
- 4075 Yellow Stone Loop
- 4079 Yellow Stone Loop
- 4073 Yellow Stone Loop
- 4071 Yellow Stone Loop
- 4083 Yellow Stone Loop
- 17431 Isle Royale Terrace
- 17433 Isle Royale Terrace
- 17429 Isle Royale Terrace
- 4085 Yellow Stone Loop
- 4087 Yellow Stone Loop
- 4089 Yellow Stone Loop
- 4082 Yellow Stone Loop
- 4091 Yellow Stone Loop
- 4084 Yellow Stone Loop
- 4086 Yellow Stone Loop
- 17425 Isle Royale Terrace
- 4088 Yellow Stone Loop
- 4090 Yellow Stone Loop
- 4093 Yellow Stone Loop
- 4092 Yellow Stone Loop
Your Personal Tour Guide
Ask me questions while you tour the home.