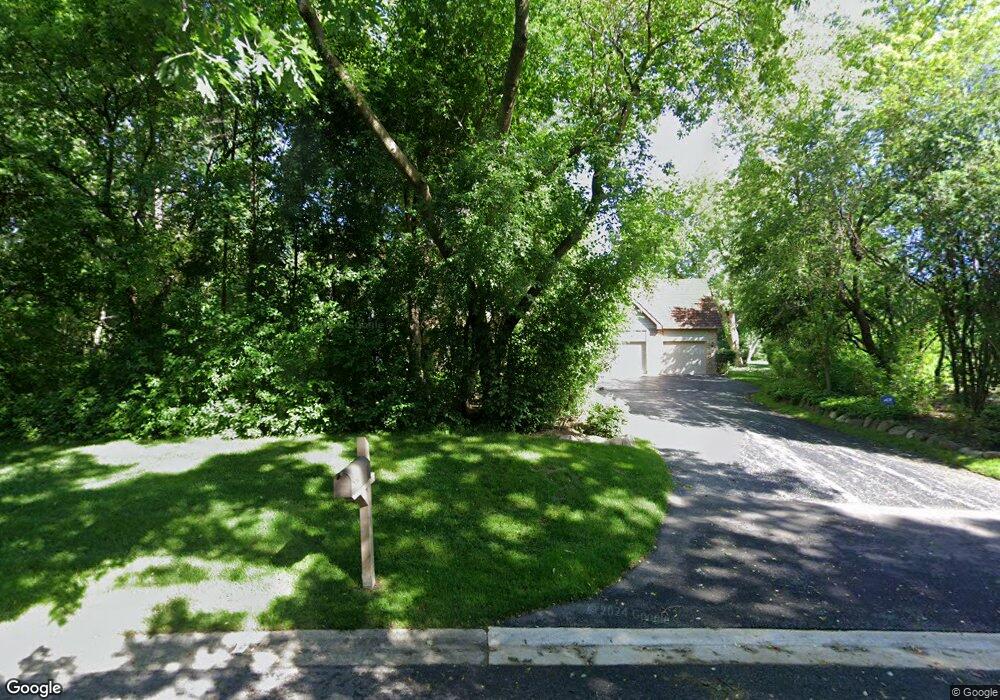
40770 N Thorne Meadow Cir Wadsworth, IL 60083
Estimated Value: $578,722 - $708,000
4
Beds
3
Baths
3,538
Sq Ft
$186/Sq Ft
Est. Value
About This Home
This home is located at 40770 N Thorne Meadow Cir, Wadsworth, IL 60083 and is currently estimated at $659,181, approximately $186 per square foot. 40770 N Thorne Meadow Cir is a home located in Lake County with nearby schools including Millburn Elementary School, Millburn Middle School, and Warren Township High School.
Ownership History
Date
Name
Owned For
Owner Type
Purchase Details
Closed on
Dec 21, 2011
Sold by
Smith James K and Smith Rynne E
Bought by
Scherr Gary and Scherr Guadalupe
Current Estimated Value
Purchase Details
Closed on
Jul 1, 1999
Sold by
Revocab Marsh Joan and Revocab Joan Marsh Declaration
Bought by
Smith James K and Smith Rynne E
Home Financials for this Owner
Home Financials are based on the most recent Mortgage that was taken out on this home.
Original Mortgage
$85,000
Interest Rate
6.62%
Purchase Details
Closed on
Sep 10, 1996
Sold by
Marsh William and Marsh Joan
Bought by
Joan Marsh Declaration Of Revocable Tr
Purchase Details
Closed on
Jul 10, 1996
Sold by
Marsh William and Marsh Joan
Bought by
Joan Marsh Declaration Revocable Trust
Create a Home Valuation Report for This Property
The Home Valuation Report is an in-depth analysis detailing your home's value as well as a comparison with similar homes in the area
Home Values in the Area
Average Home Value in this Area
Purchase History
| Date | Buyer | Sale Price | Title Company |
|---|---|---|---|
| Scherr Gary | $385,000 | City Suburban Title | |
| Smith James K | $445,000 | -- | |
| Joan Marsh Declaration Of Revocable Tr | -- | -- | |
| Joan Marsh Declaration Revocable Trust | -- | -- |
Source: Public Records
Mortgage History
| Date | Status | Borrower | Loan Amount |
|---|---|---|---|
| Previous Owner | Smith James K | $85,000 |
Source: Public Records
Tax History Compared to Growth
Tax History
| Year | Tax Paid | Tax Assessment Tax Assessment Total Assessment is a certain percentage of the fair market value that is determined by local assessors to be the total taxable value of land and additions on the property. | Land | Improvement |
|---|---|---|---|---|
| 2024 | $13,552 | $158,125 | $31,563 | $126,562 |
| 2023 | $16,051 | $144,980 | $29,048 | $115,932 |
| 2022 | $16,051 | $140,225 | $28,302 | $111,923 |
| 2021 | $15,573 | $138,234 | $27,900 | $110,334 |
| 2020 | $15,031 | $135,020 | $27,251 | $107,769 |
| 2019 | $14,266 | $129,665 | $26,170 | $103,495 |
| 2018 | $13,889 | $131,019 | $25,967 | $105,052 |
| 2017 | $13,638 | $128,588 | $25,485 | $103,103 |
| 2016 | $13,077 | $124,288 | $24,633 | $99,655 |
| 2015 | $12,548 | $117,375 | $23,263 | $94,112 |
| 2014 | $11,689 | $114,156 | $22,625 | $91,531 |
| 2012 | $11,352 | $116,059 | $23,002 | $93,057 |
Source: Public Records
Map
Nearby Homes
- 40140 N Mill Creek Rd
- 40491 N Goldenrod Ln
- 17320 W Il Route 173
- 39976 Jonathan Knolls Ln
- 15925 Applewood Ct
- 16149 Scenic Ct
- 13472 W Hart St
- 39587 Orchard Bluff Ln
- 39579 Orchard Bluff Ln
- 41115-41318 Mill Creek Rd
- 16355 W Plaza Ln
- 17049 W Edwards Rd
- 14960 W 21st St
- 40404 N Belle Foret Dr
- 40485 N Belle Foret Dr
- 40417 N Belle Foret Dr
- 14916 W Concord Ct
- 14786 W Concord Ct
- 14887 W Concord Ct
- 14835 W Concord Ct
- 16756 W Cherrywood Ln
- 40800 N Thorne Meadow Cir
- 40783 N Thorne Meadow Cir
- 16764 W Cherrywood Ln
- 40814 N Thorne Meadow Cir
- 16789 W Cherrywood Ln
- 16693 W Cherrywood Ln
- 40813 N Thorne Meadow Cir
- 16705 W Cherrywood Ln
- 40826 N Thorne Meadow Cir
- 16651 W Cherrywood Ln
- 16796 W Cherrywood Ln
- 16801 W Cherrywood Ln
- 16616 W Cherrywood Ln
- 40830 N Mill Creek Rd
- 16816 W Cherrywood Ln
- 16809 W Cherrywood Ln
- 16598 W Cherrywood Ln
- 16813 W Cherrywood Ln
- 16574 W Cherrywood Ln