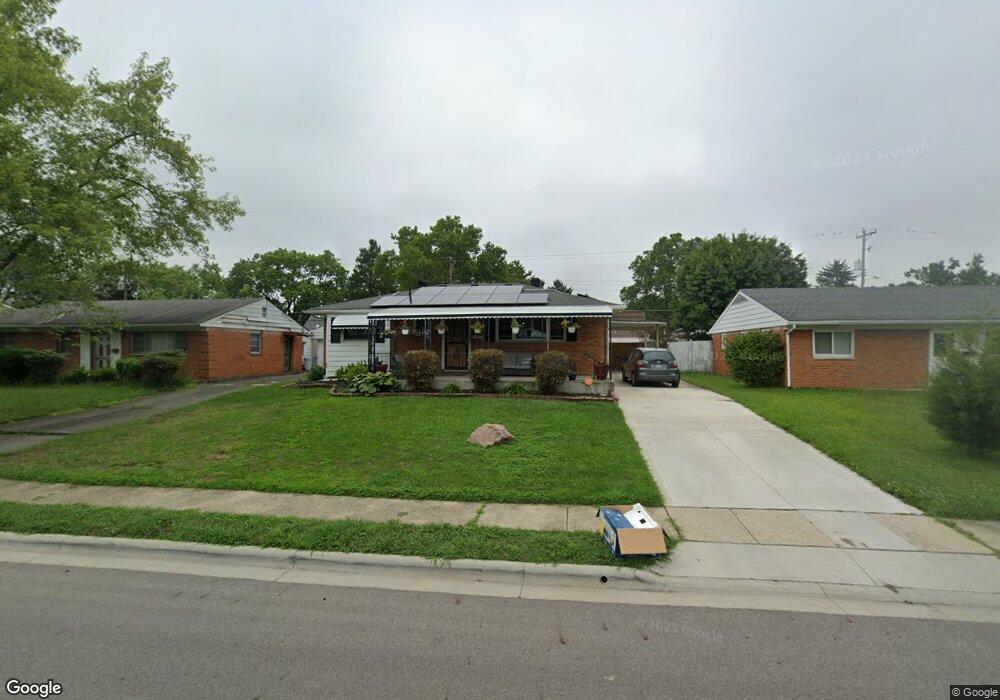
4078 E Mound St Columbus, OH 43227
Estimated Value: $194,000 - $246,000
3
Beds
2
Baths
1,800
Sq Ft
$124/Sq Ft
Est. Value
About This Home
This home is located at 4078 E Mound St, Columbus, OH 43227 and is currently estimated at $223,052, approximately $123 per square foot. 4078 E Mound St is a home located in Franklin County with nearby schools including Beechwood Elementary School, Etna Road Elementary School, and Rosemore Middle School.
Ownership History
Date
Name
Owned For
Owner Type
Purchase Details
Closed on
Jun 14, 2019
Sold by
Oliver Linda Y
Bought by
Oliver Linda Y and Oliver Ricquia
Current Estimated Value
Home Financials for this Owner
Home Financials are based on the most recent Mortgage that was taken out on this home.
Original Mortgage
$94,400
Outstanding Balance
$82,113
Interest Rate
3.99%
Mortgage Type
Adjustable Rate Mortgage/ARM
Estimated Equity
$140,939
Purchase Details
Closed on
Oct 30, 2014
Sold by
Golden Ralph E and Golden Patricia A
Bought by
Oliver Linda Y
Home Financials for this Owner
Home Financials are based on the most recent Mortgage that was taken out on this home.
Original Mortgage
$72,675
Interest Rate
3.25%
Mortgage Type
Adjustable Rate Mortgage/ARM
Purchase Details
Closed on
Oct 2, 1986
Bought by
Golden Ralph E
Create a Home Valuation Report for This Property
The Home Valuation Report is an in-depth analysis detailing your home's value as well as a comparison with similar homes in the area
Home Values in the Area
Average Home Value in this Area
Purchase History
| Date | Buyer | Sale Price | Title Company |
|---|---|---|---|
| Oliver Linda Y | -- | Landsel Title Box | |
| Oliver Linda Y | $76,500 | None Available | |
| Golden Ralph E | -- | -- |
Source: Public Records
Mortgage History
| Date | Status | Borrower | Loan Amount |
|---|---|---|---|
| Open | Oliver Linda Y | $94,400 | |
| Closed | Oliver Linda Y | $72,675 |
Source: Public Records
Tax History
| Year | Tax Paid | Tax Assessment Tax Assessment Total Assessment is a certain percentage of the fair market value that is determined by local assessors to be the total taxable value of land and additions on the property. | Land | Improvement |
|---|---|---|---|---|
| 2025 | $2,751 | $62,940 | $14,460 | $48,480 |
| 2024 | $2,751 | $62,940 | $14,460 | $48,480 |
| 2023 | $2,732 | $62,930 | $14,455 | $48,475 |
| 2022 | $2,381 | $41,690 | $5,780 | $35,910 |
| 2021 | $2,236 | $41,690 | $5,780 | $35,910 |
| 2020 | $2,272 | $41,690 | $5,780 | $35,910 |
| 2019 | $2,035 | $33,320 | $4,620 | $28,700 |
| 2018 | $1,821 | $32,170 | $4,620 | $27,550 |
| 2017 | $1,898 | $32,170 | $4,620 | $27,550 |
| 2016 | $1,626 | $24,890 | $5,180 | $19,710 |
| 2015 | $1,640 | $24,890 | $5,180 | $19,710 |
| 2014 | $1,687 | $24,890 | $5,180 | $19,710 |
| 2013 | $890 | $27,615 | $5,740 | $21,875 |
Source: Public Records
Map
Nearby Homes
- 957 Rose Place
- 3990 Astor Ave
- 3955 E Fulton St
- 963 Erickson Ave
- 1275 Elaine Rd
- 1265 Elderwood Ave
- 1035 E Fulton St
- 1001 Beechwood Rd
- 4024 Colby Ave
- 1294 Dellwood Ave
- 931 E Fulton St
- 1269 Carolwood Ave
- 1301 Bernhard Rd
- 798 S Yearling Rd
- 4174 Wright Park
- 745 Pierce Ave
- 1085 S Hamilton Rd
- 1469 Burlington Ave
- 1356 Harlow Rd
- 1490 Elaine Rd Unit 1462
- 4070 E Mound St
- 4086 E Mound St
- 4064 E Mound St
- 4092 E Mound St
- 4115 Andrus Ave
- 4107 Andrus Ave
- 4123 Andrus Ave
- 4099 Andrus Ave
- 4100 E Mound St
- 4056 E Mound St
- 4073 E Mound St
- 4083 E Mound St
- 0 E Mound St
- 4133 Andrus Ave
- 4091 Andrus Ave
- 4065 E Mound St
- 4091 E Mound St
- 4048 E Mound St
- 4108 E Mound St
- 4057 E Mound St
Your Personal Tour Guide
Ask me questions while you tour the home.