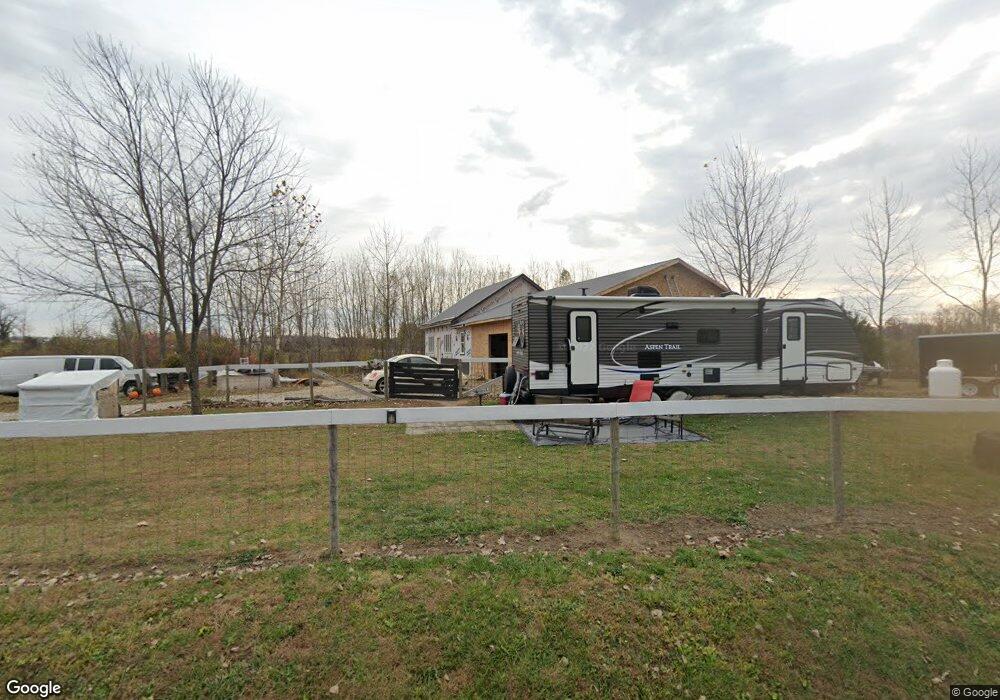
4078 Olive Rd Plymouth, IN 46563
Estimated Value: $216,000 - $352,000
2
Beds
2
Baths
1,200
Sq Ft
$237/Sq Ft
Est. Value
About This Home
This home is located at 4078 Olive Rd, Plymouth, IN 46563 and is currently estimated at $284,477, approximately $237 per square foot. 4078 Olive Rd is a home with nearby schools including LaVille Elementary School and LaVille Junior - Senior High School.
Ownership History
Date
Name
Owned For
Owner Type
Purchase Details
Closed on
Sep 4, 2020
Sold by
Hicks Colby Walker
Bought by
Keller Kenneth R and Keller Terri J
Current Estimated Value
Home Financials for this Owner
Home Financials are based on the most recent Mortgage that was taken out on this home.
Original Mortgage
$36,000
Outstanding Balance
$32,939
Interest Rate
4.75%
Mortgage Type
New Conventional
Estimated Equity
$251,538
Purchase Details
Closed on
Jun 24, 2019
Sold by
Mueller Eric P
Bought by
Hicks Colby Walker
Purchase Details
Closed on
Oct 20, 2017
Sold by
Mueller Sarah Jo
Bought by
Mueller Eric P
Purchase Details
Closed on
May 14, 2009
Sold by
Cashen Daniel C and Cashen Beth M
Bought by
Mueller Eric P and Mueller Sarah Jo
Purchase Details
Closed on
Oct 30, 2007
Sold by
Cashen Daniecl C and Cashen Beth M
Bought by
Cashen Daniel C and Cashen Beth M
Create a Home Valuation Report for This Property
The Home Valuation Report is an in-depth analysis detailing your home's value as well as a comparison with similar homes in the area
Home Values in the Area
Average Home Value in this Area
Purchase History
| Date | Buyer | Sale Price | Title Company |
|---|---|---|---|
| Keller Kenneth R | -- | None Available | |
| Hicks Colby Walker | -- | Metropolitan Title In Llc | |
| Mueller Eric P | -- | None Available | |
| Mueller Eric P | $30,000 | Mckesson Title Corp | |
| Mueller Eric P | -- | None Available | |
| Cashen Daniel C | -- | None Available |
Source: Public Records
Mortgage History
| Date | Status | Borrower | Loan Amount |
|---|---|---|---|
| Open | Keller Kenneth R | $36,000 |
Source: Public Records
Tax History Compared to Growth
Tax History
| Year | Tax Paid | Tax Assessment Tax Assessment Total Assessment is a certain percentage of the fair market value that is determined by local assessors to be the total taxable value of land and additions on the property. | Land | Improvement |
|---|---|---|---|---|
| 2024 | $2,292 | $235,500 | $61,800 | $173,700 |
| 2022 | $2,292 | $111,900 | $57,700 | $54,200 |
| 2021 | $353 | $20,000 | $20,000 | $0 |
| 2020 | $320 | $19,400 | $19,400 | $0 |
| 2019 | $294 | $18,700 | $18,700 | $0 |
| 2018 | $297 | $18,700 | $18,700 | $0 |
| 2017 | $226 | $18,300 | $18,300 | $0 |
| 2016 | $232 | $17,800 | $17,800 | $0 |
| 2014 | $240 | $18,200 | $18,200 | $0 |
Source: Public Records
Map
Nearby Homes