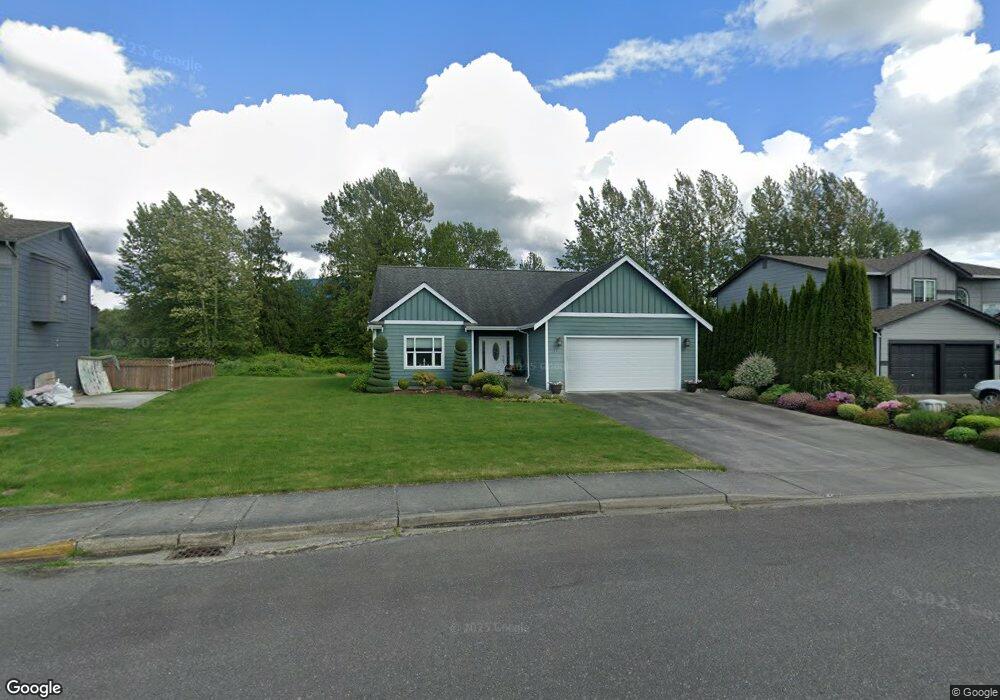
408 Allison Way Nooksack, WA 98276
Estimated Value: $505,000 - $532,000
3
Beds
2
Baths
1,691
Sq Ft
$307/Sq Ft
Est. Value
About This Home
This home is located at 408 Allison Way, Nooksack, WA 98276 and is currently estimated at $518,540, approximately $306 per square foot. 408 Allison Way is a home with nearby schools including Nooksack Elementary School, Everson Elementary School, and Sumas Elementary School.
Ownership History
Date
Name
Owned For
Owner Type
Purchase Details
Closed on
Aug 28, 2013
Sold by
Gruizenga Chad A
Bought by
Gruizenga Chad A and Gruizenga Ma N
Current Estimated Value
Home Financials for this Owner
Home Financials are based on the most recent Mortgage that was taken out on this home.
Original Mortgage
$155,000
Outstanding Balance
$115,512
Interest Rate
4.33%
Mortgage Type
New Conventional
Estimated Equity
$403,028
Purchase Details
Closed on
May 17, 2006
Sold by
Blankers Peter
Bought by
Gruizenga Chad A
Home Financials for this Owner
Home Financials are based on the most recent Mortgage that was taken out on this home.
Original Mortgage
$55,000
Interest Rate
6.52%
Mortgage Type
Fannie Mae Freddie Mac
Purchase Details
Closed on
Jan 10, 2006
Sold by
Blankers Glenda G
Bought by
Blankers Peter H
Create a Home Valuation Report for This Property
The Home Valuation Report is an in-depth analysis detailing your home's value as well as a comparison with similar homes in the area
Purchase History
| Date | Buyer | Sale Price | Title Company |
|---|---|---|---|
| Gruizenga Chad A | -- | Whatcom Land Title | |
| Gruizenga Chad A | $110,180 | First American Title Insuran | |
| Blankers Peter H | -- | First American Title Insuran | |
| Blankers Peter H | $95,280 | First American Title Insuran |
Source: Public Records
Mortgage History
| Date | Status | Borrower | Loan Amount |
|---|---|---|---|
| Open | Gruizenga Chad A | $155,000 | |
| Closed | Gruizenga Chad A | $55,000 |
Source: Public Records
Tax History
| Year | Tax Paid | Tax Assessment Tax Assessment Total Assessment is a certain percentage of the fair market value that is determined by local assessors to be the total taxable value of land and additions on the property. | Land | Improvement |
|---|---|---|---|---|
| 2025 | $4,342 | $468,110 | $188,100 | $280,010 |
| 2024 | $4,398 | $453,180 | $180,000 | $273,180 |
| 2023 | $4,398 | $476,735 | $137,744 | $338,991 |
| 2022 | $3,918 | $429,499 | $124,096 | $305,403 |
| 2021 | $3,639 | $354,963 | $102,560 | $252,403 |
| 2020 | $3,492 | $288,594 | $83,384 | $205,210 |
| 2019 | $2,953 | $288,594 | $83,384 | $205,210 |
| 2018 | $3,377 | $276,882 | $80,000 | $196,882 |
| 2017 | $3,025 | $236,301 | $63,800 | $172,501 |
| 2016 | $2,892 | $218,059 | $58,850 | $159,209 |
| 2015 | $2,394 | $209,175 | $56,760 | $152,415 |
| 2014 | -- | $202,689 | $55,000 | $147,689 |
| 2013 | -- | $48,950 | $48,950 | $0 |
Source: Public Records
Map
Nearby Homes
- 407 E 2nd St
- 209 Nooksack Ave
- 705 E 6th St
- 404 W 3rd St
- 310 W 3rd St
- 412 W 3rd St
- 308 W 3rd St
- 304 W 3rd St
- 403 Westview Place
- 3292 S Pass Rd
- 405 Jackson Ct
- 109 W 2nd St
- 107 Thendara Park Dr Unit C
- 7554 Nooksack Rd
- 110 Baker St Unit A & B
- 108 Baker St Unit 1-4
- 216 W 4th St
- 208 W 4th St
- 413 W 4th St
- 212 W 4th St
- 406 Allison Way
- 410 Allison Way
- 404 Allison Way
- 412 Allison Way
- 402 Allison Way
- 411 Allison Way
- 414 Allison Way
- 316 Allison Way
- 413 Allison Way
- 409 Allison Way
- 416 Allison Way
- 415 Allison Way
- 407 Allison Way
- 314 Allison Way
- 501 Allison Way
- 502 Allison Way
- 412 E 2nd St
- 410 E 2nd St
- 414 E 2nd St
- 312 Allison Way
Your Personal Tour Guide
Ask me questions while you tour the home.