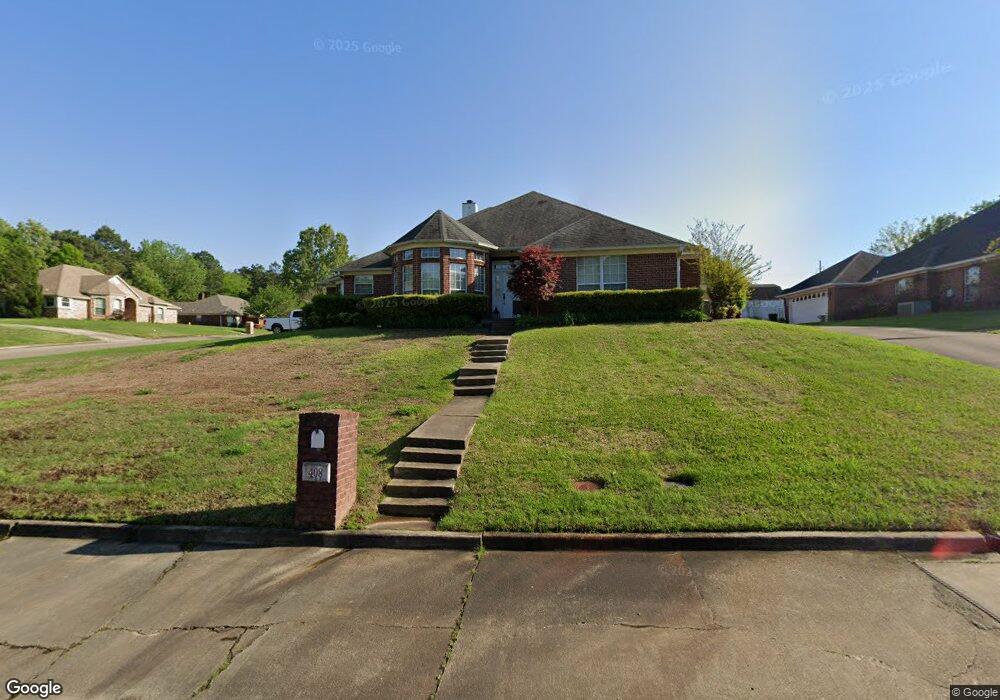
408 Boulder Ridge Cir Texarkana, AR 71854
Estimated Value: $312,658 - $363,000
--
Bed
3
Baths
2,294
Sq Ft
$148/Sq Ft
Est. Value
About This Home
This home is located at 408 Boulder Ridge Cir, Texarkana, AR 71854 and is currently estimated at $339,415, approximately $147 per square foot. 408 Boulder Ridge Cir is a home located in Miller County with nearby schools including Arkansas High School, St. James Day School, and Trinity Christian School.
Ownership History
Date
Name
Owned For
Owner Type
Purchase Details
Closed on
Jun 20, 2008
Sold by
Quillin Michael A and Quillin Samantha G
Bought by
Martinez Samuel S and Martinez Terri
Current Estimated Value
Home Financials for this Owner
Home Financials are based on the most recent Mortgage that was taken out on this home.
Original Mortgage
$161,721
Outstanding Balance
$103,457
Interest Rate
5.99%
Mortgage Type
FHA
Estimated Equity
$235,958
Purchase Details
Closed on
Aug 9, 2002
Bought by
Quillin Michael A and Quillin Samantha G
Purchase Details
Closed on
Jun 26, 2002
Bought by
Quillin Michael A and Quillin Samantha G
Purchase Details
Closed on
Sep 7, 2001
Bought by
Baugh Charles R
Purchase Details
Closed on
Jun 29, 2000
Bought by
Wade Faye
Purchase Details
Closed on
Dec 1, 1999
Bought by
Regions Bank
Purchase Details
Closed on
Sep 15, 1997
Bought by
Matthews Debra
Purchase Details
Closed on
Jan 1, 1996
Bought by
Matthews Donald
Create a Home Valuation Report for This Property
The Home Valuation Report is an in-depth analysis detailing your home's value as well as a comparison with similar homes in the area
Home Values in the Area
Average Home Value in this Area
Purchase History
| Date | Buyer | Sale Price | Title Company |
|---|---|---|---|
| Martinez Samuel S | $163,000 | Twin City Title | |
| Quillin Michael A | -- | -- | |
| Quillin Michael A | $147,000 | -- | |
| Baugh Charles R | $135,000 | -- | |
| Wade Faye | $129,000 | -- | |
| Regions Bank | $143,400 | -- | |
| Matthews Debra | -- | -- | |
| Matthews Donald | $16,700 | -- |
Source: Public Records
Mortgage History
| Date | Status | Borrower | Loan Amount |
|---|---|---|---|
| Open | Martinez Samuel S | $161,721 |
Source: Public Records
Tax History Compared to Growth
Tax History
| Year | Tax Paid | Tax Assessment Tax Assessment Total Assessment is a certain percentage of the fair market value that is determined by local assessors to be the total taxable value of land and additions on the property. | Land | Improvement |
|---|---|---|---|---|
| 2024 | $2,131 | $45,840 | $4,090 | $41,750 |
| 2023 | $2,092 | $45,840 | $4,090 | $41,750 |
| 2022 | $2,142 | $45,840 | $4,090 | $41,750 |
| 2021 | $2,072 | $45,840 | $4,090 | $41,750 |
| 2020 | $1,961 | $45,840 | $4,090 | $41,750 |
| 2019 | $1,834 | $40,240 | $4,090 | $36,150 |
| 2018 | $1,859 | $40,240 | $4,090 | $36,150 |
| 2017 | $1,859 | $40,240 | $4,090 | $36,150 |
| 2016 | $1,859 | $40,240 | $4,090 | $36,150 |
| 2015 | $1,835 | $39,806 | $4,090 | $35,716 |
| 2014 | $1,731 | $37,910 | $4,090 | $33,820 |
Source: Public Records
Map
Nearby Homes
- 204 Boulder Ridge Cir
- 5409-5411 N State Line Ave
- 6428 Edgehill Cir
- 301 Forest Lake Dr
- 10 Sweetbrush Ave
- 0 Lakeridge Dr
- 6707 Lakeridge Dr
- Lot 7 Blk 5 Treasure Hill
- 6712 N Hills Dr
- 6506 Lakeview Dr
- Lot 15 Lakeview Dr
- 6727 N Hills Dr
- 6616 Lakeridge Dr
- 803 Lakeridge Place
- 6632 Lakeridge Dr
- 4.94 Acres Mount Olive Dr
- 5411 N State Line Ave
- 6133 Timberwood Ln
- 6005 Timberwood Ln
- 6021 Summerwood Ln
- 404 Boulder Ridge Cir
- 409 Rock Ridge Cir
- 405 Rock Ridge Cir
- 7004 Castlerock Dr
- 6916 Castlerock Dr
- 316 Boulder Ridge Cir
- 409 Boulder Ridge Cir
- 7008 Castlerock Dr
- 405 Boulder Ridge Cir
- 6912 Castlerock Dr
- 317 Rock Ridge Cir
- 317 Boulder Ridge Cir
- 7012 Castlerock Dr
- 312 Boulder Ridge Cir
- 6908 Castlerock Dr
- 313 Rock Ridge Cir
- 313 Boulder Ridge Cir
- 408 Rock Ridge Cir
- 404 Rock Ridge Cir
- 308 Boulder Ridge Cir