Estimated Value: $367,000 - $423,000
4
Beds
3
Baths
2,256
Sq Ft
$176/Sq Ft
Est. Value
About This Home
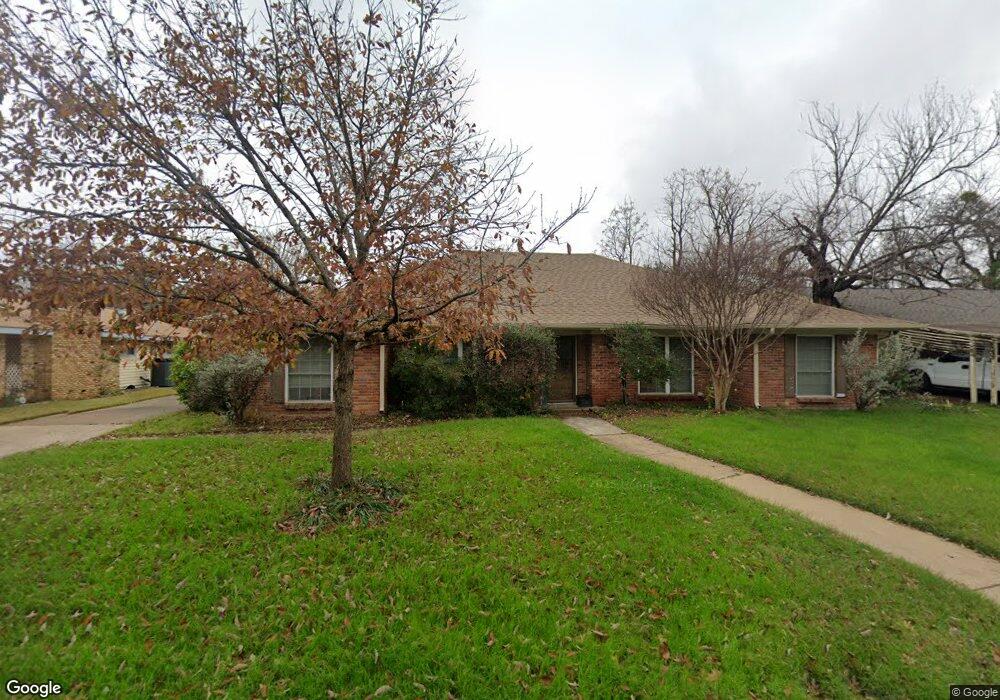
This home is located at 408 Brookview Dr, Hurst, TX 76054 and is currently estimated at $396,972, approximately $175 per square foot. 408 Brookview Dr is a home located in Tarrant County with nearby schools including Shady Oaks Elementary School, Bedford Junior High School, and L.D. Bell High School.
Ownership History
Date
Name
Owned For
Owner Type
Purchase Details
Closed on
Jun 17, 2015
Sold by
Hall Eric A and Hall Christina L Eure
Bought by
Kowis David L and Kowis Rebekah S
Current Estimated Value
Home Financials for this Owner
Home Financials are based on the most recent Mortgage that was taken out on this home.
Original Mortgage
$223,644
Outstanding Balance
$174,202
Interest Rate
3.91%
Mortgage Type
VA
Estimated Equity
$222,770
Purchase Details
Closed on
Jul 21, 2005
Sold by
Green Tommy
Bought by
Hall Eric A and Eure Christina L
Home Financials for this Owner
Home Financials are based on the most recent Mortgage that was taken out on this home.
Original Mortgage
$127,920
Interest Rate
6.22%
Mortgage Type
Fannie Mae Freddie Mac
Purchase Details
Closed on
Jul 21, 2001
Sold by
Mayes Mary D
Bought by
Green Tommy
Home Financials for this Owner
Home Financials are based on the most recent Mortgage that was taken out on this home.
Original Mortgage
$104,000
Interest Rate
7.07%
Create a Home Valuation Report for This Property
The Home Valuation Report is an in-depth analysis detailing your home's value as well as a comparison with similar homes in the area
Home Values in the Area
Average Home Value in this Area
Purchase History
| Date | Buyer | Sale Price | Title Company |
|---|---|---|---|
| Kowis David L | -- | None Available | |
| Hall Eric A | -- | None Available | |
| Green Tommy | -- | Allegiance Title Co |
Source: Public Records
Mortgage History
| Date | Status | Borrower | Loan Amount |
|---|---|---|---|
| Open | Kowis David L | $223,644 | |
| Previous Owner | Hall Eric A | $127,920 | |
| Previous Owner | Green Tommy | $104,000 |
Source: Public Records
Tax History
| Year | Tax Paid | Tax Assessment Tax Assessment Total Assessment is a certain percentage of the fair market value that is determined by local assessors to be the total taxable value of land and additions on the property. | Land | Improvement |
|---|---|---|---|---|
| 2025 | $4,022 | $272,685 | $80,000 | $192,685 |
| 2024 | $4,022 | $272,685 | $80,000 | $192,685 |
| 2023 | $5,144 | $277,703 | $55,000 | $222,703 |
| 2022 | $5,374 | $233,423 | $55,000 | $178,423 |
| 2021 | $5,234 | $217,005 | $55,000 | $162,005 |
| 2020 | $6,125 | $254,593 | $55,000 | $199,593 |
| 2019 | $6,314 | $262,044 | $55,000 | $207,044 |
| 2018 | $5,834 | $238,348 | $55,000 | $183,348 |
| 2017 | $5,396 | $213,220 | $40,000 | $173,220 |
| 2016 | $4,095 | $183,197 | $40,000 | $143,197 |
| 2015 | $3,404 | $147,100 | $17,000 | $130,100 |
| 2014 | $3,404 | $147,100 | $17,000 | $130,100 |
Source: Public Records
Map
Nearby Homes
- 532 Plainview Dr
- 1428 Pamela St
- 413 Baker Dr
- 612 Circleview Dr S
- 600 Circleview Dr N
- 440 W Louella Dr
- 201 Hillview Dr
- 201 W Louella Dr
- 1613 Green Tree Dr
- 1352 Simpson Dr
- 1625 Oak Creek Dr
- 1913 Yucca Trail
- 1348 Norwood Dr
- 1905 Cimarron Trail
- 1236 Harrison Ln
- 180 Oakhurst Dr
- 137 E Louella Dr
- 404 Mountainview Dr
- 421 Cavender Ct
- 1208 Karla Dr
- 412 Brookview Dr
- 404 Brookview Dr
- 409 W Pleasantview Dr
- 405 W Pleasantview Dr
- 413 W Pleasantview Dr
- 416 Brookview Dr
- 409 Brookview Dr
- 400 Brookview Dr
- 413 Brookview Dr
- 405 Brookview Dr
- 417 W Pleasantview Dr
- 401 W Pleasantview Dr
- 401 Brookview Dr
- 417 Brookview Dr
- 420 Brookview Dr
- 421 W Pleasantview Dr
- 408 Plainview Dr
- 404 Plainview Dr
- 408 W Pleasantview Dr
- 421 Brookview Dr
Your Personal Tour Guide
Ask me questions while you tour the home.