Estimated Value: $389,566 - $476,000
3
Beds
2
Baths
2,157
Sq Ft
$192/Sq Ft
Est. Value
About This Home
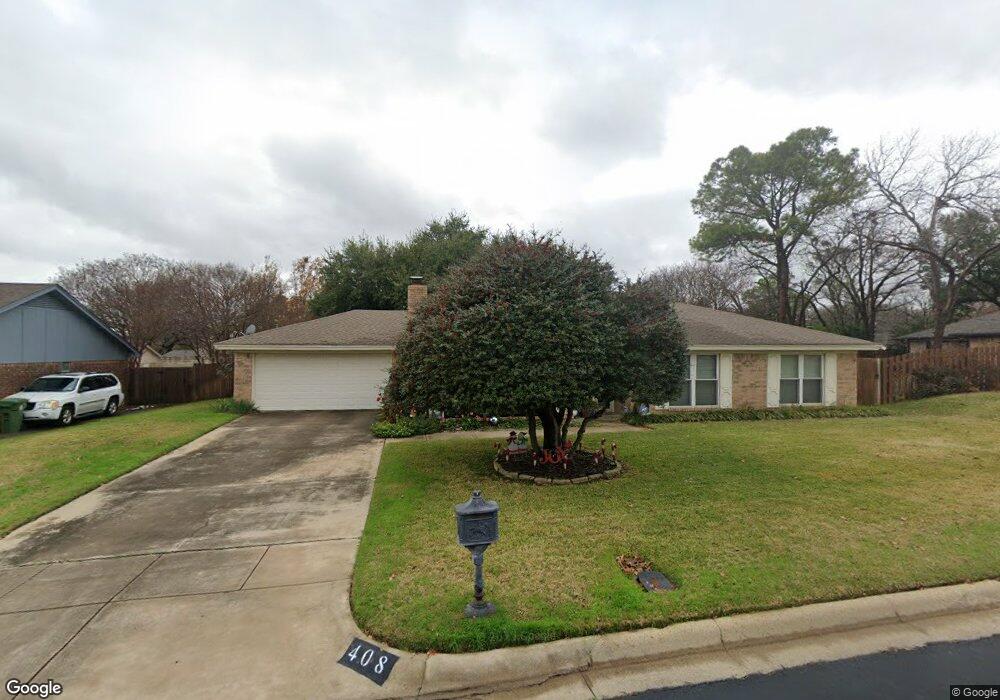
This home is located at 408 Chisholm Trail, Hurst, TX 76054 and is currently estimated at $414,142, approximately $191 per square foot. 408 Chisholm Trail is a home located in Tarrant County with nearby schools including Shady Oaks Elementary School, Bedford Junior High School, and L.D. Bell High School.
Ownership History
Date
Name
Owned For
Owner Type
Purchase Details
Closed on
Oct 11, 2021
Sold by
Millican Melinda Gay
Bought by
Millican Melinda Gay and Millican Melinda Revocable
Current Estimated Value
Purchase Details
Closed on
Oct 11, 2010
Sold by
Wells Mary Beth Plummer
Bought by
Millican Melinda
Home Financials for this Owner
Home Financials are based on the most recent Mortgage that was taken out on this home.
Original Mortgage
$95,000
Outstanding Balance
$62,786
Interest Rate
4.38%
Mortgage Type
New Conventional
Estimated Equity
$351,356
Purchase Details
Closed on
Dec 4, 2007
Sold by
The Robert E & Mary Beth Plummer Revocab
Bought by
Plummer Mary Beth
Purchase Details
Closed on
Aug 19, 1993
Sold by
Zuber M Marion
Bought by
Plummer Robert E and Plummer Mary Beth
Home Financials for this Owner
Home Financials are based on the most recent Mortgage that was taken out on this home.
Original Mortgage
$65,000
Interest Rate
7.18%
Create a Home Valuation Report for This Property
The Home Valuation Report is an in-depth analysis detailing your home's value as well as a comparison with similar homes in the area
Home Values in the Area
Average Home Value in this Area
Purchase History
| Date | Buyer | Sale Price | Title Company |
|---|---|---|---|
| Millican Melinda Gay | -- | None Available | |
| Millican Melinda | -- | Alamo Title Company | |
| Plummer Mary Beth | -- | Alamo Title Company | |
| Plummer Robert E | -- | Lawyers American Title Co |
Source: Public Records
Mortgage History
| Date | Status | Borrower | Loan Amount |
|---|---|---|---|
| Open | Millican Melinda | $95,000 | |
| Previous Owner | Plummer Robert E | $65,000 |
Source: Public Records
Tax History
| Year | Tax Paid | Tax Assessment Tax Assessment Total Assessment is a certain percentage of the fair market value that is determined by local assessors to be the total taxable value of land and additions on the property. | Land | Improvement |
|---|---|---|---|---|
| 2025 | $4,304 | $356,528 | $75,000 | $281,528 |
| 2024 | $4,304 | $356,528 | $75,000 | $281,528 |
| 2023 | $6,935 | $359,488 | $55,000 | $304,488 |
| 2022 | $7,246 | $318,536 | $55,000 | $263,536 |
| 2021 | $6,900 | $286,086 | $55,000 | $231,086 |
| 2020 | $6,284 | $261,211 | $55,000 | $206,211 |
| 2019 | $6,367 | $267,349 | $55,000 | $212,349 |
| 2018 | $5,132 | $236,500 | $55,000 | $181,500 |
| 2017 | $5,441 | $215,000 | $18,000 | $197,000 |
| 2016 | $5,033 | $209,886 | $18,000 | $191,886 |
| 2015 | $4,247 | $180,800 | $18,000 | $162,800 |
| 2014 | $4,247 | $180,800 | $18,000 | $162,800 |
Source: Public Records
Map
Nearby Homes
- 2204 Mountainview Dr
- 2201 Mountainview Dr
- 317 Northglen Dr
- 2244 Hurstview Dr
- 2221 Farrington Ln
- 2157 Lookout Ct
- 617 Indian Trail
- 421 Cavender Ct
- 404 Mountainview Dr
- 200 Eagle Ct
- 2620 Brookridge Dr
- 305 Warbler Dr
- 1905 Cimarron Trail
- 3006 Carolyn Ct
- 3002 Carolyn Ct
- 417 Sunnybrook Ct
- 413 Blue Jay Ct
- 440 W Louella Dr
- 3716 Sweetbriar Ln
- 405 Woodbriar Ct
- 412 Chisholm Trail
- 2212 Cambridge Dr
- 404 Chisholm Trail
- 2216 Cambridge Dr
- 425 Chisholm Trail
- 421 Chisholm Trail
- 2208 Cambridge Dr
- 2224 Cambridge Dr
- 429 Chisholm Trail
- 416 Chisholm Trail
- 417 Chisholm Trail
- 2204 Cambridge Dr
- 433 Chisholm Trail
- 2217 Cambridge Dr
- 2213 Cambridge Dr
- 420 Chisholm Trail
- 413 Chisholm Trail
- 405 Chisholm Trail
- 2221 Cambridge Dr
- 2209 Cambridge Dr
Your Personal Tour Guide
Ask me questions while you tour the home.