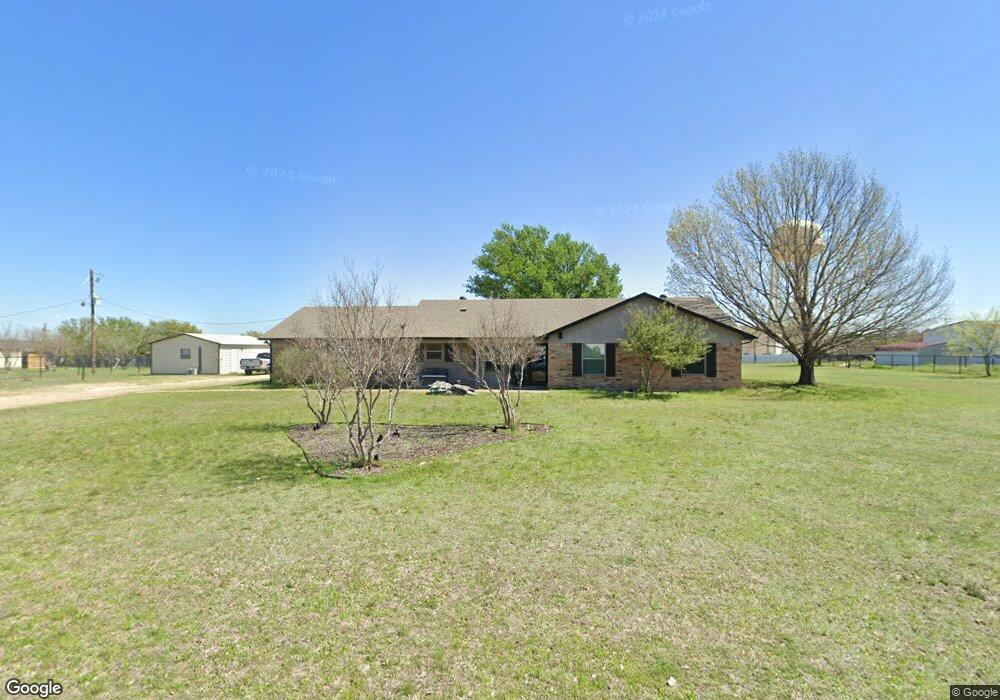
408 Cook Rd Willow Park, TX 76087
Estimated Value: $399,000 - $413,000
3
Beds
2
Baths
1,805
Sq Ft
$225/Sq Ft
Est. Value
About This Home
This home is located at 408 Cook Rd, Willow Park, TX 76087 and is currently estimated at $405,922, approximately $224 per square foot. 408 Cook Rd is a home located in Parker County with nearby schools including Martin Elementary School, Tison Middle School, and Weatherford High School.
Ownership History
Date
Name
Owned For
Owner Type
Purchase Details
Closed on
Sep 4, 2012
Sold by
Secretary Of Housing & Urban Development
Bought by
Zara Todd S
Current Estimated Value
Home Financials for this Owner
Home Financials are based on the most recent Mortgage that was taken out on this home.
Original Mortgage
$114,000
Outstanding Balance
$78,846
Interest Rate
3.56%
Mortgage Type
New Conventional
Estimated Equity
$327,076
Purchase Details
Closed on
May 22, 2012
Sold by
Citimortgage Inc
Bought by
The Secretary Of Housing & Urban Develop
Purchase Details
Closed on
May 1, 2012
Sold by
Sells Mikki M and Sells James A
Bought by
Citimortgage Inc
Purchase Details
Closed on
Jul 25, 2008
Sold by
Franklin David A and Franklin Elaine D
Bought by
Sells James A and Sells Mikki M
Home Financials for this Owner
Home Financials are based on the most recent Mortgage that was taken out on this home.
Original Mortgage
$151,381
Interest Rate
6.4%
Mortgage Type
Purchase Money Mortgage
Create a Home Valuation Report for This Property
The Home Valuation Report is an in-depth analysis detailing your home's value as well as a comparison with similar homes in the area
Home Values in the Area
Average Home Value in this Area
Purchase History
| Date | Buyer | Sale Price | Title Company |
|---|---|---|---|
| Zara Todd S | -- | None Available | |
| The Secretary Of Housing & Urban Develop | -- | None Available | |
| Citimortgage Inc | $161,623 | None Available | |
| Sells James A | -- | Ct |
Source: Public Records
Mortgage History
| Date | Status | Borrower | Loan Amount |
|---|---|---|---|
| Open | Zara Todd S | $114,000 | |
| Previous Owner | Sells James A | $151,381 |
Source: Public Records
Tax History Compared to Growth
Tax History
| Year | Tax Paid | Tax Assessment Tax Assessment Total Assessment is a certain percentage of the fair market value that is determined by local assessors to be the total taxable value of land and additions on the property. | Land | Improvement |
|---|---|---|---|---|
| 2025 | $5,597 | $363,059 | -- | -- |
| 2024 | $5,597 | $321,717 | -- | -- |
| 2023 | $5,597 | $292,470 | $0 | $0 |
| 2022 | $6,116 | $265,890 | $50,000 | $215,890 |
| 2021 | $6,107 | $265,890 | $50,000 | $215,890 |
| 2020 | $5,036 | $213,910 | $35,000 | $178,910 |
| 2019 | $4,829 | $213,910 | $35,000 | $178,910 |
| 2018 | $4,410 | $191,740 | $35,000 | $156,740 |
| 2017 | $4,077 | $191,740 | $35,000 | $156,740 |
| 2016 | $3,706 | $139,530 | $25,000 | $114,530 |
| 2015 | $3,063 | $139,530 | $25,000 | $114,530 |
| 2014 | -- | $122,350 | $25,000 | $97,350 |
Source: Public Records
Map
Nearby Homes
- 4500 White Settlement Rd
- Lot 1M Crest
- 1231 E Lake Dr
- 117 Post Oak Ct
- 4525 White Settlement Rd
- 1117 Mountain View Dr
- 1208 Valley Ridge Dr
- 1225 Crown Valley Dr
- 1733 E Lake Dr
- 1025 Gannon Valley Trail
- 1028 Gannon Valley Trail
- 1016 Emery Ct
- 1305 Thistle Hill Trail
- 72 Crown Rd
- Chapman Plan at Parker Ridge
- Tucker Plan at Parker Ridge
- 1101 Crown Valley Dr
- 1001 Emery Ct
- 151 Regent Ct
- 1106 Reata Dr