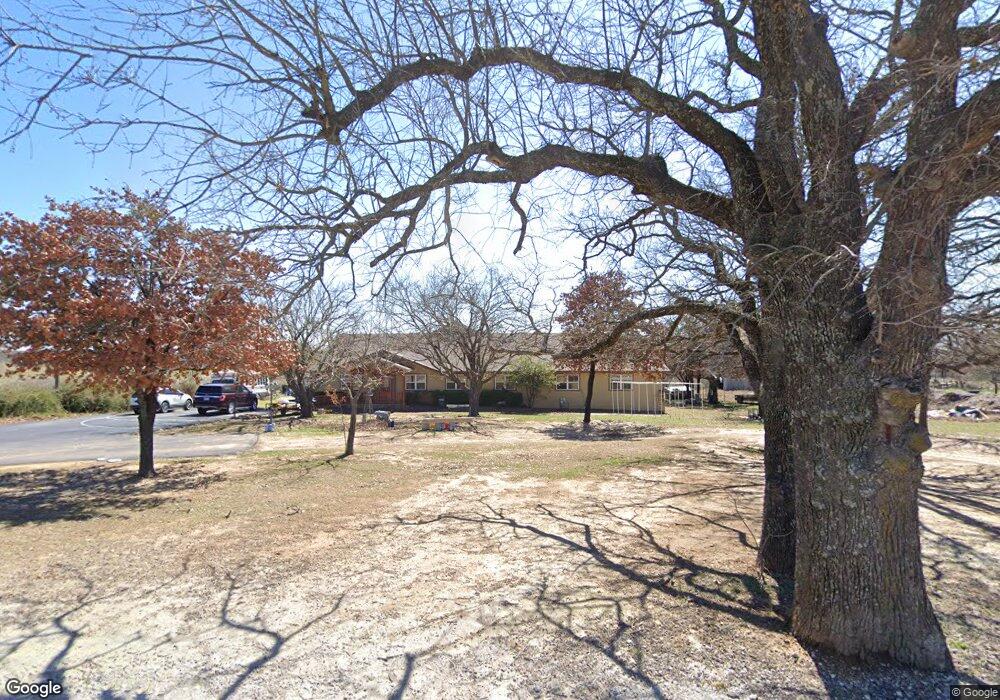
408 County Road 134 Gainesville, TX 76240
Estimated Value: $349,000 - $672,000
4
Beds
2
Baths
1,444
Sq Ft
$303/Sq Ft
Est. Value
About This Home
This home is located at 408 County Road 134, Gainesville, TX 76240 and is currently estimated at $437,673, approximately $303 per square foot. 408 County Road 134 is a home located in Cooke County with nearby schools including Callisburg Elementary School, Callisburg Middle School, and Callisburg High School.
Ownership History
Date
Name
Owned For
Owner Type
Purchase Details
Closed on
Nov 5, 2025
Sold by
Waite Tracy
Bought by
Davis Rodney and Davis Labreeska
Current Estimated Value
Purchase Details
Closed on
Oct 29, 2010
Sold by
White Ronnie
Bought by
Davis Rodney S and Davis Labreeska
Home Financials for this Owner
Home Financials are based on the most recent Mortgage that was taken out on this home.
Original Mortgage
$80,000
Interest Rate
4.27%
Mortgage Type
Purchase Money Mortgage
Purchase Details
Closed on
Nov 17, 2009
Sold by
Nationastar Mortagge Llc
Bought by
White Ronnie
Home Financials for this Owner
Home Financials are based on the most recent Mortgage that was taken out on this home.
Original Mortgage
$63,750
Interest Rate
4.93%
Purchase Details
Closed on
Jul 13, 2009
Sold by
Scruggs Doyle and Scruggs Kim
Bought by
Harvey Kelly
Create a Home Valuation Report for This Property
The Home Valuation Report is an in-depth analysis detailing your home's value as well as a comparison with similar homes in the area
Home Values in the Area
Average Home Value in this Area
Purchase History
| Date | Buyer | Sale Price | Title Company |
|---|---|---|---|
| Davis Rodney | -- | None Listed On Document | |
| Davis Rodney S | -- | -- | |
| White Ronnie | -- | -- | |
| Harvey Kelly | -- | -- |
Source: Public Records
Mortgage History
| Date | Status | Borrower | Loan Amount |
|---|---|---|---|
| Previous Owner | Davis Rodney S | $80,000 | |
| Previous Owner | White Ronnie | $63,750 |
Source: Public Records
Tax History Compared to Growth
Tax History
| Year | Tax Paid | Tax Assessment Tax Assessment Total Assessment is a certain percentage of the fair market value that is determined by local assessors to be the total taxable value of land and additions on the property. | Land | Improvement |
|---|---|---|---|---|
| 2025 | $2,148 | $283,726 | $80,000 | $419,109 |
| 2024 | $2,148 | $291,965 | $80,000 | $211,965 |
| 2023 | $2,674 | $209,433 | $75,000 | $182,321 |
| 2022 | $2,824 | $231,480 | $65,000 | $166,480 |
| 2021 | $3,165 | $190,082 | $50,000 | $140,082 |
| 2020 | $3,067 | $192,208 | $50,000 | $142,208 |
| 2019 | $2,787 | $145,855 | $40,000 | $105,855 |
| 2018 | $2,547 | $130,974 | $34,000 | $96,974 |
| 2017 | $1,899 | $96,060 | $28,000 | $68,060 |
| 2015 | $1,631 | $94,285 | $28,000 | $66,285 |
| 2014 | $1,631 | $94,285 | $28,000 | $66,285 |
Source: Public Records
Map
Nearby Homes
- 411 Center Hill Rd
- 91 acres Cr-189
- 783 County Road 128
- 638 County Road 119
- TBD County Road 131
- 0000 County Road 121
- 00 Brown Springs Rd
- 398 Phillips St
- 316 County Road 173
- TBD County Rd 131
- 107 Cr 173
- 4401 E U S Highway 82
- 108 Post Oak Ln
- 401 Austin St
- TBD Cr 136
- 409 Austin St
- 1546 County Road 123
- TBD County Road 148
- 1448 County Road 123
- 3210 Rural Ranch Rd Unit 14
- 408 Cr-134
- 431 County Road 134
- 478 County Road 134
- 566 County Road 134
- 566 Cr-134
- 236 County Road 134
- 249 County Road 134
- 630 County Road 134
- 578 County Road 134
- 215 Mcnew Rd
- 149 County Road 134
- 125 County Road 134
- 97 Mcnew Rd
- 626 Harper Lease Rd
- 0 Cr 134 Unit 10645442
- 0 Cr 134
- 824 County Road 134
- 3878 Fm 371
- 3697 Fm 371
- 914 County Road 134