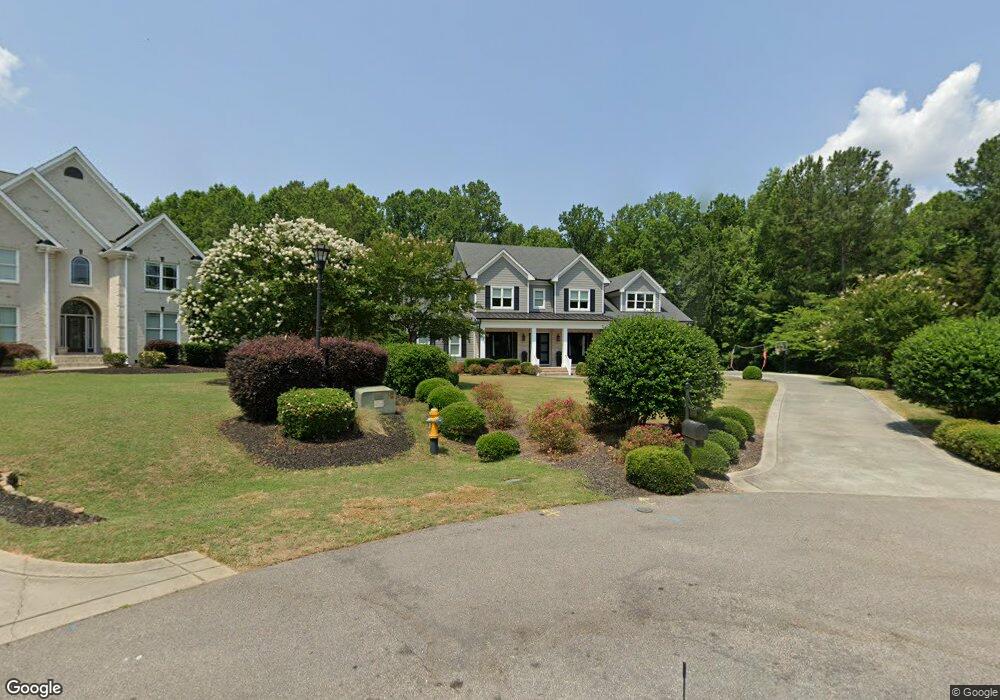
408 Deep Woods Trail Unit 53 Wake Forest, NC 27587
Falls Lake NeighborhoodEstimated Value: $1,249,000 - $1,703,000
--
Bed
1
Bath
5,674
Sq Ft
$262/Sq Ft
Est. Value
About This Home
This home is located at 408 Deep Woods Trail Unit 53, Wake Forest, NC 27587 and is currently estimated at $1,484,064, approximately $261 per square foot. 408 Deep Woods Trail Unit 53 is a home located in Wake County with nearby schools including Forest Pines Drive Elementary School, Wake Forest-Rolesville Middle School, and Wake Forest High School.
Ownership History
Date
Name
Owned For
Owner Type
Purchase Details
Closed on
May 4, 2020
Sold by
Wolins Barry Robert and Wolins Michelle Marie
Bought by
Barnes Chad Joseph and Barnes Ashley Rae
Current Estimated Value
Home Financials for this Owner
Home Financials are based on the most recent Mortgage that was taken out on this home.
Original Mortgage
$249,600
Outstanding Balance
$220,888
Interest Rate
3.23%
Mortgage Type
New Conventional
Estimated Equity
$1,263,176
Purchase Details
Closed on
Sep 9, 2010
Sold by
Chase William A and Chase Rhea B
Bought by
Wolins Barry Robert and Wolins Michelle Marie
Purchase Details
Closed on
Jul 28, 2010
Sold by
Equity Resource Partners Iii Llc
Bought by
Chase William A and Townsend James T
Purchase Details
Closed on
Aug 3, 2005
Sold by
St Ives Llc
Bought by
Clearwater Group Ltd
Create a Home Valuation Report for This Property
The Home Valuation Report is an in-depth analysis detailing your home's value as well as a comparison with similar homes in the area
Home Values in the Area
Average Home Value in this Area
Purchase History
| Date | Buyer | Sale Price | Title Company |
|---|---|---|---|
| Barnes Chad Joseph | $950,000 | None Available | |
| Wolins Barry Robert | $68,000 | None Available | |
| Chase William A | $120,000 | None Available | |
| Equity Resource Partners Iii Llc | $1,323,900 | None Available | |
| Clearwater Group Ltd | $373,000 | None Available |
Source: Public Records
Mortgage History
| Date | Status | Borrower | Loan Amount |
|---|---|---|---|
| Open | Barnes Chad Joseph | $249,600 | |
| Closed | Barnes Chad Joseph | $249,600 | |
| Open | Barnes Chad Joseph | $510,400 |
Source: Public Records
Tax History Compared to Growth
Tax History
| Year | Tax Paid | Tax Assessment Tax Assessment Total Assessment is a certain percentage of the fair market value that is determined by local assessors to be the total taxable value of land and additions on the property. | Land | Improvement |
|---|---|---|---|---|
| 2025 | $13,090 | $1,370,069 | $270,000 | $1,100,069 |
| 2024 | $13,041 | $1,370,069 | $270,000 | $1,100,069 |
| 2023 | $9,102 | $781,558 | $115,000 | $666,558 |
| 2022 | $8,730 | $781,558 | $115,000 | $666,558 |
| 2021 | $8,578 | $781,558 | $115,000 | $666,558 |
| 2020 | $8,578 | $781,558 | $115,000 | $666,558 |
| 2019 | $8,718 | $701,084 | $100,000 | $601,084 |
| 2018 | $8,254 | $701,084 | $100,000 | $601,084 |
| 2017 | $7,977 | $701,084 | $100,000 | $601,084 |
| 2016 | $7,876 | $701,084 | $100,000 | $601,084 |
| 2015 | $9,512 | $836,640 | $135,000 | $701,640 |
| 2014 | $1,482 | $135,000 | $135,000 | $0 |
Source: Public Records
Map
Nearby Homes
- 2957 Wexford Pond Way
- 2849 Penfold Ln
- 7932 Wexford Waters Ln
- 2808 Wexford Forest Ln
- 7808 Ailesbury Rd
- 8008 Wexford Waters Ln
- 7805 Ailesbury Rd
- 2637 Buckeye Ct
- 7813 Ailesbury Rd
- 7961 Wexford Waters Ln
- 7824 Ailesbury Rd
- 2809 Elsbeth Ct
- 2508 Kearney Rd
- 8000 Wexford Waters Ln
- 7317 Wexford Woods Ln
- 2728 Trifle Ln
- 2605 Mica Mine Ln
- 2409 Mica Mine Ln
- 12753 Wake Union Church Rd
- 2968 Ocean Sunrise Dr
- 408 Deep Woods Trail
- 404 Deep Woods Trail
- 412 Deep Woods Trail
- 7312 Sparhawk Rd
- 7308 Sparhawk Rd
- 1317 Gironde Ct
- 1313 Gironde Ct Unit 56
- 1309 Gironde Ct
- 409 Deep Woods Trail
- 7304 Sparhawk Rd
- 7316 Sparhawk Rd
- 405 Deep Woods Trail
- 405 Deep Woods Trail Unit Lot50
- 7320 Sparhawk Rd
- 504 Capellan St
- 401 Deep Woods Trail
- 1321 Gironde Ct
- 500 Capellan St
- 416 Capellan St
- 7300 Sparhawk Rd