408 E 20th Terrace Kearney, MO 64060
Estimated Value: $390,000 - $479,000
About This Home
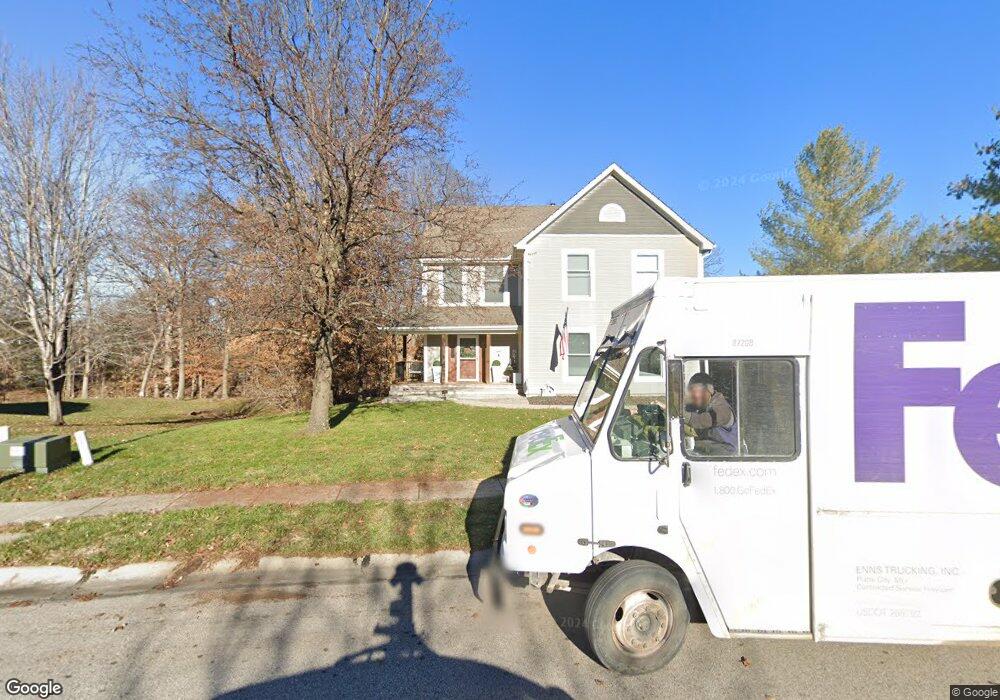
This home is located at 408 E 20th Terrace, Kearney, MO 64060 and is currently estimated at $439,428, approximately $181 per square foot. 408 E 20th Terrace is a home located in Clay County with nearby schools including Kearney Junior High School and Kearney High School.
Ownership History
We collect this data history from publicly available records. To have your information removed, we recommend requesting removal directly through your county’s website.
Purchase Details
Purchase Details
Home Financials for this Owner
Home Financials are based on the most recent Mortgage that was taken out on this home.Purchase Details
Purchase Details
Home Financials for this Owner
Home Financials are based on the most recent Mortgage that was taken out on this home.Home Values in the Area
Average Home Value in this Area
Purchase History
We collect this data history from publicly available records. To have your information removed, we recommend requesting removal directly through your county’s website.
| Date | Buyer | Sale Price | Title Company |
|---|---|---|---|
| -- | Accurate Title Company Llc | ||
| -- | Continental Title | ||
| $192,467 | None Available | ||
| -- | First American Title Ins Co |
Mortgage History
We collect this data history from publicly available records. To have your information removed, we recommend requesting removal directly through your county’s website.
| Date | Status | Borrower | Loan Amount |
|---|---|---|---|
| Open | $183,670 | ||
| Previous Owner | $38,024 |
Tax History
We collect this data history from publicly available records. To have your information removed, we recommend requesting removal directly through your county’s website.
| Year | Tax Paid | Tax Assessment Tax Assessment Total Assessment is a certain percentage of the fair market value that is determined by local assessors to be the total taxable value of land and additions on the property. | Land | Improvement |
|---|---|---|---|---|
| 2025 | $4,491 | $68,630 | -- | -- |
| 2024 | $4,141 | $60,420 | -- | -- |
| 2023 | $4,127 | $60,420 | $0 | $0 |
| 2022 | $3,669 | $51,950 | $0 | $0 |
| 2021 | $3,597 | $51,946 | $5,434 | $46,512 |
| 2020 | $3,421 | $44,940 | $0 | $0 |
| 2019 | $3,403 | $44,935 | $5,434 | $39,501 |
| 2018 | $3,583 | $45,700 | $0 | $0 |
| 2017 | $3,037 | $45,690 | $5,430 | $40,260 |
| 2016 | $3,037 | $39,150 | $5,430 | $33,720 |
| 2015 | $3,038 | $39,150 | $5,430 | $33,720 |
| 2014 | $2,959 | $37,960 | $5,850 | $32,110 |
Map
- 1925 Meadowlane
- 307 E 22nd St
- 1816 Rose St
- 2028 Greenfield Mews
- 2371 Prairie Creek Dr
- 2367 Prairie Creek Dr
- 1709 Cambridge Cir
- 1708 Marble Dr
- 2119 Greenfield Point
- 2121 Greenfield Point
- 2209 Greenfield Ct
- 2204 Prairie Creek Dr
- 2211 Prairie Creek Dr
- 2002 Foxtail Point
- 111 Dogwood Ln
- 107 Dogwood Ln
- 2357 Prairie Creek Dr
- 1314 Susan St
- 318 Old Trail Run N A
- 1700 Debrah Dr
- 408 E 20th Terrace
- 406 E 20th Terrace
- 410 E 20th Terrace
- 406 E 20th Terrace
- 407 E 20th Terrace
- 407 E 20th Terrace
- 404 E 20th Terrace
- 405 E 20th Terrace
- 404 E 20th Terrace
- 409 E 21st St
- 406 E 21st St
- 1909 Meadowlane
- 407 E 21st St
- 403 E 20th Terrace
- 402 E 20th Terrace
- 404 E 21st St
- 1907 Meadowlane
- 1911 Meadowlane
- 402 E 21st St
- 400 E 20th Terrace
Ask me questions while you tour the home.