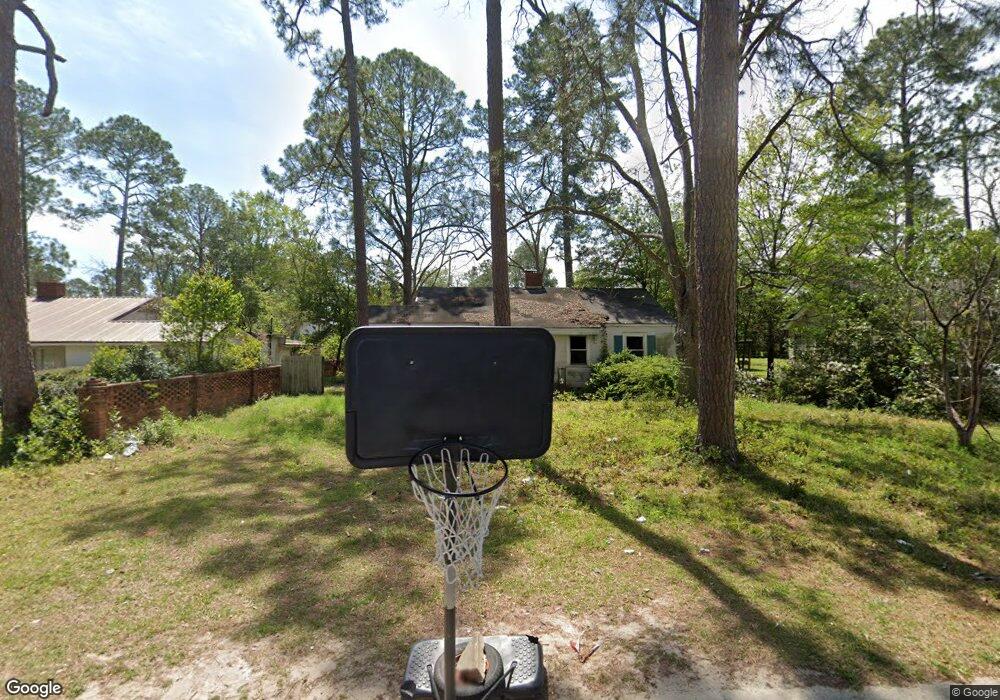
408 E 23rd Ave Cordele, GA 31015
Estimated Value: $56,889 - $104,000
3
Beds
1
Bath
1,072
Sq Ft
$76/Sq Ft
Est. Value
About This Home
This home is located at 408 E 23rd Ave, Cordele, GA 31015 and is currently estimated at $81,722, approximately $76 per square foot. 408 E 23rd Ave is a home located in Crisp County with nearby schools including Crisp County Elementary School, Crisp County Primary School, and Crisp County Middle School.
Ownership History
Date
Name
Owned For
Owner Type
Purchase Details
Closed on
May 28, 2020
Sold by
Nipper Gerald Wayne
Bought by
Clack Jimmy
Current Estimated Value
Purchase Details
Closed on
Nov 24, 2008
Sold by
Federal Home Loan Mortgage Corporation
Bought by
Nipper Gerald Wayne and Nipper Melanie Outen
Home Financials for this Owner
Home Financials are based on the most recent Mortgage that was taken out on this home.
Original Mortgage
$29,242
Interest Rate
6.01%
Mortgage Type
New Conventional
Purchase Details
Closed on
Jun 3, 2008
Sold by
Countrywide Home Loans Inc
Bought by
Federal Home Loan Mortgage Corporation
Purchase Details
Closed on
Dec 5, 1997
Sold by
Thompson James Etal
Bought by
Compton Brian K
Purchase Details
Closed on
Jun 29, 1992
Bought by
Thompson James Etal
Purchase Details
Closed on
Apr 30, 1990
Bought by
Jolly James A Etal
Purchase Details
Closed on
Oct 22, 1980
Sold by
Little Ernest
Bought by
Canterbury Elliott and Canterbury Carol
Create a Home Valuation Report for This Property
The Home Valuation Report is an in-depth analysis detailing your home's value as well as a comparison with similar homes in the area
Purchase History
| Date | Buyer | Sale Price | Title Company |
|---|---|---|---|
| Clack Jimmy | $7,500 | -- | |
| Nipper Gerald Wayne | $33,500 | -- | |
| Federal Home Loan Mortgage Corporation | $26,627 | -- | |
| Countrywide Home Loans Inc | $26,627 | -- | |
| Compton Brian K | $40,500 | -- | |
| Thompson James Etal | $35,500 | -- | |
| Jolly James A Etal | $33,000 | -- | |
| Canterbury Elliott | $32,600 | -- |
Source: Public Records
Mortgage History
| Date | Status | Borrower | Loan Amount |
|---|---|---|---|
| Previous Owner | Nipper Gerald Wayne | $29,242 |
Source: Public Records
Tax History
| Year | Tax Paid | Tax Assessment Tax Assessment Total Assessment is a certain percentage of the fair market value that is determined by local assessors to be the total taxable value of land and additions on the property. | Land | Improvement |
|---|---|---|---|---|
| 2025 | $164 | $4,638 | $1,500 | $3,138 |
| 2024 | $158 | $4,400 | $1,500 | $2,900 |
| 2023 | $161 | $4,282 | $1,500 | $2,782 |
| 2022 | $110 | $4,163 | $1,500 | $2,663 |
| 2021 | $108 | $4,044 | $1,500 | $2,544 |
| 2020 | $132 | $4,706 | $1,500 | $3,206 |
| 2019 | $133 | $4,706 | $1,500 | $3,206 |
| 2018 | $369 | $12,527 | $2,400 | $10,127 |
| 2017 | $509 | $12,527 | $2,400 | $10,127 |
| 2016 | $370 | $12,527 | $2,400 | $10,127 |
| 2015 | -- | $12,527 | $2,400 | $10,127 |
| 2014 | -- | $12,527 | $2,400 | $10,127 |
| 2013 | -- | $12,526 | $2,400 | $10,126 |
Source: Public Records
Map
Nearby Homes
Your Personal Tour Guide
Ask me questions while you tour the home.