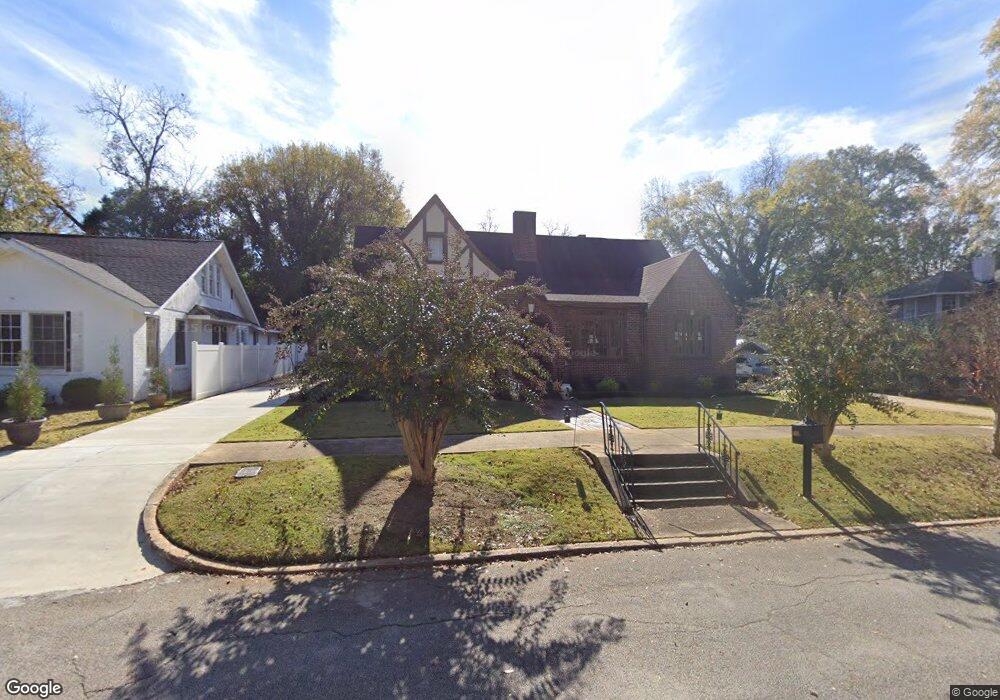
408 E 6th St West Point, GA 31833
Estimated Value: $261,000 - $312,000
4
Beds
3
Baths
2,866
Sq Ft
$97/Sq Ft
Est. Value
About This Home
This home is located at 408 E 6th St, West Point, GA 31833 and is currently estimated at $278,416, approximately $97 per square foot. 408 E 6th St is a home located in Troup County with nearby schools including West Point Elementary School, Long Cane Elementary School, and Whitesville Road Elementary School.
Ownership History
Date
Name
Owned For
Owner Type
Purchase Details
Closed on
Mar 19, 2021
Sold by
Godfrey Kimberly S
Bought by
Davis Wanda Adams
Current Estimated Value
Home Financials for this Owner
Home Financials are based on the most recent Mortgage that was taken out on this home.
Original Mortgage
$150,000
Interest Rate
2.8%
Mortgage Type
New Conventional
Purchase Details
Closed on
Feb 16, 2018
Sold by
Morkes Debra E
Bought by
Godfrey Kimberly S and Godfrey David J
Home Financials for this Owner
Home Financials are based on the most recent Mortgage that was taken out on this home.
Original Mortgage
$164,803
Interest Rate
4.04%
Mortgage Type
New Conventional
Purchase Details
Closed on
Mar 4, 1994
Sold by
Gex Gex and Gex Right
Bought by
Morkes Debra E
Purchase Details
Closed on
Oct 5, 1989
Sold by
Vivian C Hodnett Estate
Bought by
Gex Gex and Gex Right
Purchase Details
Closed on
Jan 1, 1930
Sold by
Mattie O Hodnett
Bought by
Vivian C Hodnett Estate
Create a Home Valuation Report for This Property
The Home Valuation Report is an in-depth analysis detailing your home's value as well as a comparison with similar homes in the area
Home Values in the Area
Average Home Value in this Area
Purchase History
| Date | Buyer | Sale Price | Title Company |
|---|---|---|---|
| Davis Wanda Adams | $200,000 | -- | |
| Godfrey Kimberly S | $169,900 | -- | |
| Morkes Debra E | $35,000 | -- | |
| Gex Gex | $49,500 | -- | |
| Vivian C Hodnett Estate | -- | -- |
Source: Public Records
Mortgage History
| Date | Status | Borrower | Loan Amount |
|---|---|---|---|
| Closed | Davis Wanda Adams | $150,000 | |
| Previous Owner | Godfrey Kimberly S | $164,803 |
Source: Public Records
Tax History
| Year | Tax Paid | Tax Assessment Tax Assessment Total Assessment is a certain percentage of the fair market value that is determined by local assessors to be the total taxable value of land and additions on the property. | Land | Improvement |
|---|---|---|---|---|
| 2025 | $3,471 | $117,560 | $2,480 | $115,080 |
| 2024 | $2,927 | $84,280 | $2,480 | $81,800 |
| 2023 | $2,916 | $81,880 | $2,480 | $79,400 |
| 2022 | $2,151 | $77,080 | $2,480 | $74,600 |
| 2021 | $2,306 | $78,440 | $2,480 | $75,960 |
| 2020 | $1,817 | $62,240 | $1,720 | $60,520 |
| 2019 | $1,887 | $64,560 | $1,720 | $62,840 |
| 2018 | $1,870 | $62,000 | $1,720 | $60,280 |
| 2017 | $1,165 | $38,616 | $1,416 | $37,200 |
| 2016 | $1,157 | $38,355 | $1,416 | $36,939 |
| 2015 | $1,153 | $38,164 | $1,225 | $36,939 |
| 2014 | $1,096 | $36,220 | $1,225 | $34,994 |
| 2013 | -- | $38,502 | $1,225 | $37,277 |
Source: Public Records
Map
Nearby Homes
- 506 E 6th St
- 707 E 7th St
- 1202 E 9th St
- 900 E 9th St
- 112 Hillcrest Rd
- 509 Cleveland St
- 1104 E 8th St
- 0 Arrowhead Dr Unit 10451860
- 128 Highland Dr
- 712 4th Ave
- 1007 4th Ave
- 1418 E 10th St
- 1026 N 6th Ave
- 403 N 15th St
- 302 N 6th Ave
- 1508 N 4th Ave
- 0 Sunset Dr Unit 10451831
- 514 N 8th Ave
- 811 Cherry Dr
- 902 1st St
Your Personal Tour Guide
Ask me questions while you tour the home.