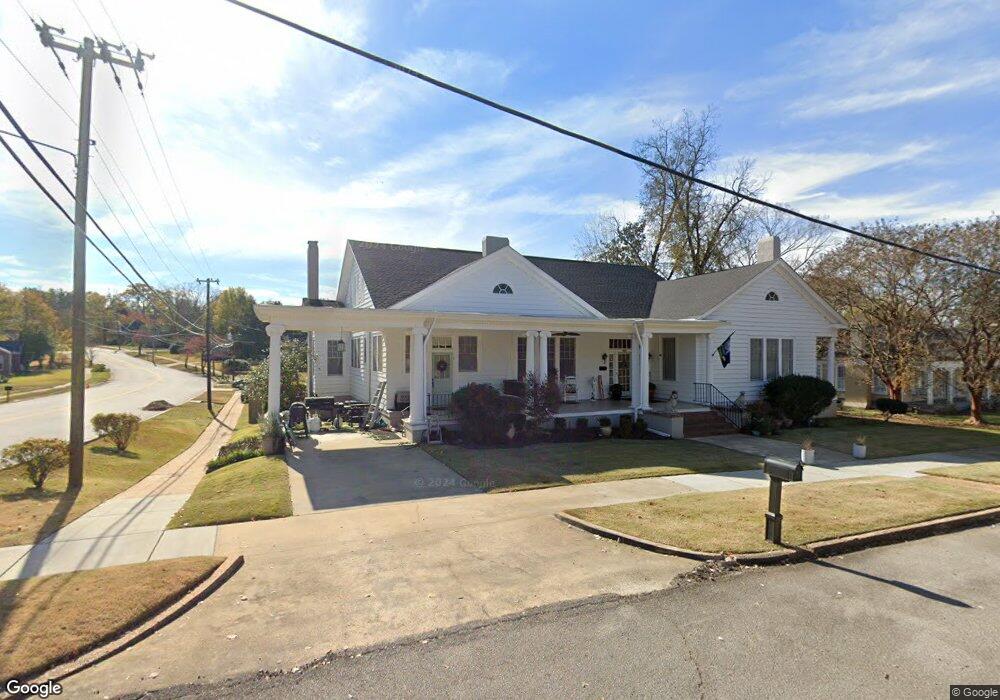
408 E 7th St West Point, GA 31833
Estimated Value: $177,381 - $216,000
4
Beds
3
Baths
3,112
Sq Ft
$63/Sq Ft
Est. Value
About This Home
This home is located at 408 E 7th St, West Point, GA 31833 and is currently estimated at $196,845, approximately $63 per square foot. 408 E 7th St is a home located in Troup County with nearby schools including West Point Elementary School, Long Cane Elementary School, and Whitesville Road Elementary School.
Ownership History
Date
Name
Owned For
Owner Type
Purchase Details
Closed on
Aug 21, 2020
Sold by
Retzlaff Timothy C
Bought by
Boley Amy
Current Estimated Value
Home Financials for this Owner
Home Financials are based on the most recent Mortgage that was taken out on this home.
Original Mortgage
$116,000
Outstanding Balance
$102,203
Interest Rate
3%
Mortgage Type
New Conventional
Estimated Equity
$94,642
Purchase Details
Closed on
Feb 1, 2018
Sold by
Mccuistion Kevin L
Bought by
Retzlaff Timothy C
Purchase Details
Closed on
Jan 19, 1990
Sold by
Interstate Telephone Co
Bought by
Mccuistion Alan L
Purchase Details
Closed on
Jul 1, 1988
Sold by
Atkins David A and Atkins Charlotte M
Bought by
Interstate Telephone Co
Purchase Details
Closed on
Oct 1, 1986
Sold by
Estelle Huguley Estate
Bought by
Atkins David A and Atkins Charlotte M
Purchase Details
Closed on
Jan 1, 1957
Sold by
Mrs W H Huguley Est
Bought by
City Of West Point
Create a Home Valuation Report for This Property
The Home Valuation Report is an in-depth analysis detailing your home's value as well as a comparison with similar homes in the area
Home Values in the Area
Average Home Value in this Area
Purchase History
| Date | Buyer | Sale Price | Title Company |
|---|---|---|---|
| Boley Amy | $120,000 | -- | |
| Retzlaff Timothy C | -- | -- | |
| Mccuistion Alan L | $70,000 | -- | |
| Interstate Telephone Co | -- | -- | |
| Atkins David A | -- | -- | |
| Estelle Huguley Estate | -- | -- | |
| City Of West Point | -- | -- |
Source: Public Records
Mortgage History
| Date | Status | Borrower | Loan Amount |
|---|---|---|---|
| Open | Boley Amy | $116,000 |
Source: Public Records
Tax History
| Year | Tax Paid | Tax Assessment Tax Assessment Total Assessment is a certain percentage of the fair market value that is determined by local assessors to be the total taxable value of land and additions on the property. | Land | Improvement |
|---|---|---|---|---|
| 2025 | $2,211 | $85,960 | $2,840 | $83,120 |
| 2024 | $2,211 | $64,040 | $2,840 | $61,200 |
| 2023 | $2,201 | $63,320 | $2,840 | $60,480 |
| 2022 | $1,381 | $51,480 | $2,840 | $48,640 |
| 2021 | $1,448 | $51,520 | $2,840 | $48,680 |
| 2020 | $1,389 | $46,040 | $1,400 | $44,640 |
| 2019 | $1,425 | $47,240 | $1,680 | $45,560 |
| 2018 | $1,059 | $45,080 | $1,680 | $43,400 |
| 2017 | $1,059 | $45,080 | $1,680 | $43,400 |
| 2016 | $1,119 | $47,041 | $1,680 | $45,361 |
| 2015 | $1,111 | $46,761 | $1,400 | $45,361 |
| 2014 | $1,039 | $44,374 | $1,400 | $42,974 |
| 2013 | -- | $47,641 | $1,400 | $46,241 |
Source: Public Records
Map
Nearby Homes
- 713 Avenue H
- 1202 E 9th St
- 311 E 4th St
- 1105 E 7th St
- 1104 E 8th St
- 0 Arrowhead Dr Unit 10451860
- 509 Cleveland St
- 112 Hillcrest Rd
- 712 4th Ave
- 128 Highland Dr
- 1007 4th Ave
- 210 N 14th St
- 0 Sunset Dr Unit 10451831
- 1314 4th Ave
- 1026 N 6th Ave
- 1508 N 4th Ave
- 514 N 8th Ave
- 811 Cherry Dr
- 1800 Malco Dr
- 608 S 1st Ave
Your Personal Tour Guide
Ask me questions while you tour the home.