Estimated Value: $289,511 - $303,000
3
Beds
3
Baths
1,844
Sq Ft
$160/Sq Ft
Est. Value
About This Home
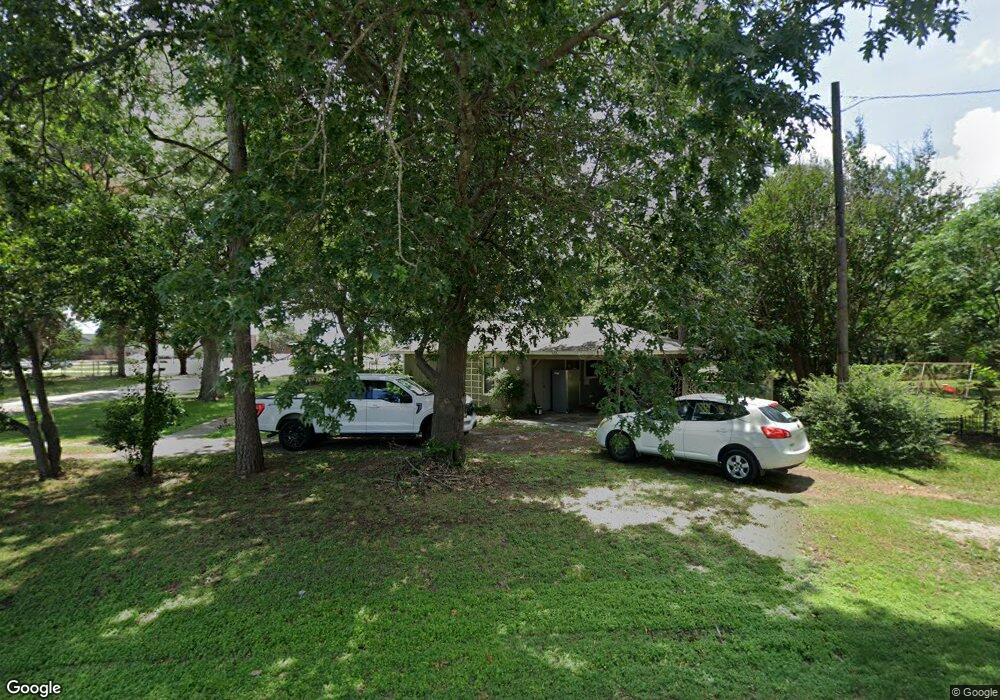
This home is located at 408 E Boyd Ave, Boyd, TX 76023 and is currently estimated at $294,170, approximately $159 per square foot. 408 E Boyd Ave is a home located in Wise County with nearby schools including Boyd Elementary School, Boyd Middle School, and Boyd High School.
Ownership History
Date
Name
Owned For
Owner Type
Purchase Details
Closed on
Apr 25, 2016
Sold by
Teague John L
Bought by
Crooks Randy and Conklin Jason
Current Estimated Value
Purchase Details
Closed on
Sep 28, 2005
Sold by
Taylor William Dwayne and Massingill Taylor Marsha Deanne
Bought by
Teague John L
Home Financials for this Owner
Home Financials are based on the most recent Mortgage that was taken out on this home.
Original Mortgage
$106,000
Interest Rate
5.76%
Mortgage Type
VA
Purchase Details
Closed on
Dec 4, 2001
Sold by
Joyner Joyner J and Joyner Thaya
Bought by
Conklin Jason and Crook Randy
Purchase Details
Closed on
Apr 7, 1999
Sold by
Cothran Martin D and Cothran Mary E
Bought by
Conklin Jason and Crook Randy
Purchase Details
Closed on
Jul 13, 1994
Bought by
Conklin Jason and Crook Randy
Purchase Details
Closed on
May 2, 1994
Bought by
Conklin Jason and Crook Randy
Purchase Details
Closed on
Jan 1, 1901
Bought by
Conklin Jason and Crook Randy
Create a Home Valuation Report for This Property
The Home Valuation Report is an in-depth analysis detailing your home's value as well as a comparison with similar homes in the area
Home Values in the Area
Average Home Value in this Area
Purchase History
| Date | Buyer | Sale Price | Title Company |
|---|---|---|---|
| Crooks Randy | -- | None Available | |
| Teague John L | -- | Wise County Title | |
| Conklin Jason | -- | -- | |
| Conklin Jason | -- | -- | |
| Conklin Jason | -- | -- | |
| Conklin Jason | -- | -- | |
| Conklin Jason | -- | -- |
Source: Public Records
Mortgage History
| Date | Status | Borrower | Loan Amount |
|---|---|---|---|
| Previous Owner | Teague John L | $106,000 |
Source: Public Records
Tax History
| Year | Tax Paid | Tax Assessment Tax Assessment Total Assessment is a certain percentage of the fair market value that is determined by local assessors to be the total taxable value of land and additions on the property. | Land | Improvement |
|---|---|---|---|---|
| 2025 | $5,984 | $312,032 | $52,500 | $259,532 |
| 2024 | $5,984 | $314,917 | $52,500 | $262,417 |
| 2023 | $5,608 | $302,264 | $52,500 | $249,764 |
| 2022 | $5,002 | $233,079 | $23,625 | $209,454 |
| 2021 | $4,162 | $187,050 | $23,630 | $163,420 |
| 2020 | $4,102 | $183,690 | $23,630 | $160,060 |
| 2019 | $3,994 | $173,770 | $19,950 | $153,820 |
| 2018 | $3,525 | $151,340 | $6,300 | $145,040 |
| 2017 | $3,379 | $141,100 | $6,300 | $134,800 |
| 2016 | $2,952 | $131,910 | $6,300 | $125,610 |
| 2015 | -- | $123,950 | $6,300 | $117,650 |
| 2014 | -- | $121,590 | $6,300 | $115,290 |
Source: Public Records
Map
Nearby Homes
- 407 E Boyd Ave
- 405 E Boyd Ave
- 403 E Boyd Ave
- 525 Highway 114 Rd
- 213 S Allen St
- 448 Mcalpine
- TBD E Rock Island Ave
- 18 Acres Highway 114 Rd
- 112 S Evans St
- 3397 2048 Hwy
- TBD S Ewing St
- 579 S Hitt St
- 306 N Agnew St
- 100 N Agnew St
- 108 N Agnew St
- 405 Edgewood Terrace
- 449 W Dunlap Ave
- 219 County Rd
- 162 Greengate Dr
- 116 Lilywood Ln
- 400 E Boyd Ave
- 409 E Boyd Ave
- 421 E Boyd Ave
- 201 S Wilson St
- 212 S Atwood St
- 208 S Atwood St
- 107 S Atwood St
- 421 S Wilson St
- 200 S Atwood St
- 204 S Atwood St
- 106 S Atwood St
- 312 W Morton St
- 209 S Hitt St
- 105 S Wilson St Unit C
- 105 S Wilson St Unit A
- 105 S Wilson St Unit D
- 105 S Wilson St
- 113 S Hitt St
- S FM730 Farm To Market Road 730 N
- 112 Po Box
Your Personal Tour Guide
Ask me questions while you tour the home.