408 E Burrell St Denison, TX 75021
Estimated Value: $189,000 - $199,807
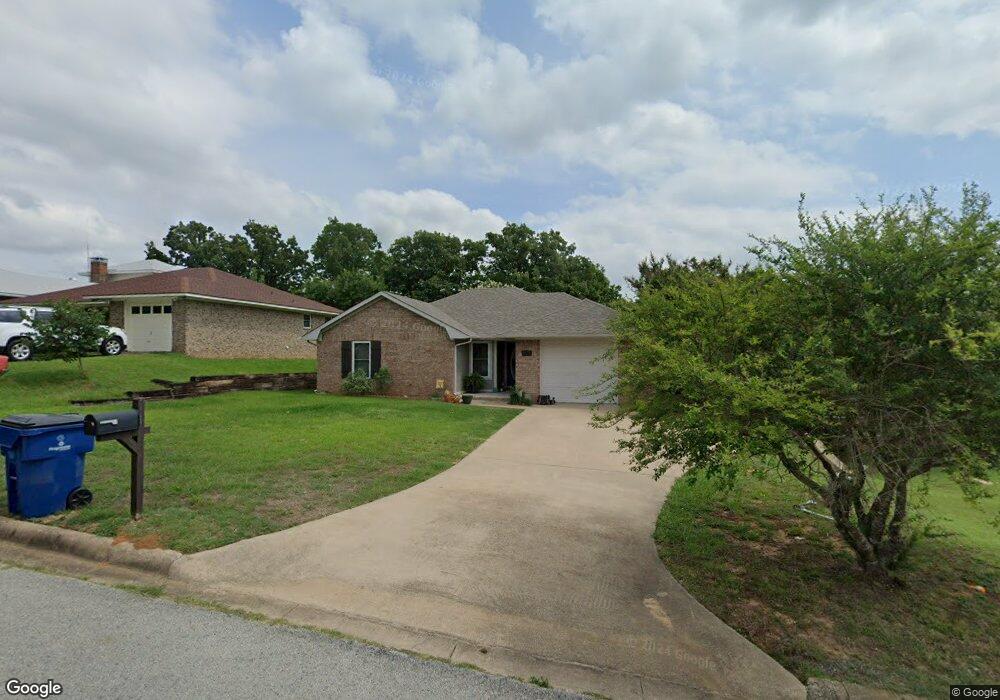
About This Home
This home is located at 408 E Burrell St, Denison, TX 75021 and is currently estimated at $194,404, approximately $149 per square foot. 408 E Burrell St is a home located in Grayson County with nearby schools including Lamar Elementary School, Scott Middle School, and Denison High School.
Ownership History
We collect this data history from publicly available records. To have your information removed, we recommend requesting removal directly through your county’s website.
Purchase Details
Purchase Details
Home Financials for this Owner
Home Financials are based on the most recent Mortgage that was taken out on this home.Home Values in the Area
Average Home Value in this Area
Purchase History
We collect this data history from publicly available records. To have your information removed, we recommend requesting removal directly through your county’s website.
| Date | Buyer | Sale Price | Title Company |
|---|---|---|---|
| -- | None Listed On Document | ||
| -- | Security Title |
Mortgage History
We collect this data history from publicly available records. To have your information removed, we recommend requesting removal directly through your county’s website.
| Date | Status | Borrower | Loan Amount |
|---|---|---|---|
| Previous Owner | $95,000 |
Tax History
We collect this data history from publicly available records. To have your information removed, we recommend requesting removal directly through your county’s website.
| Year | Tax Paid | Tax Assessment Tax Assessment Total Assessment is a certain percentage of the fair market value that is determined by local assessors to be the total taxable value of land and additions on the property. | Land | Improvement |
|---|---|---|---|---|
| 2025 | $4,422 | $197,909 | $39,600 | $158,309 |
| 2024 | $4,422 | $190,332 | $34,380 | $155,952 |
| 2023 | $4,050 | $178,743 | $34,380 | $144,363 |
| 2022 | $3,646 | $153,456 | $34,380 | $119,076 |
| 2021 | $3,483 | $138,106 | $16,920 | $121,186 |
| 2020 | $3,427 | $129,939 | $16,920 | $113,019 |
| 2019 | $3,495 | $127,010 | $11,250 | $115,760 |
| 2018 | $3,274 | $118,005 | $11,250 | $106,755 |
| 2017 | $2,977 | $106,426 | $11,250 | $95,176 |
| 2016 | $2,810 | $100,429 | $11,250 | $89,179 |
| 2015 | $2,596 | $91,893 | $6,480 | $85,413 |
| 2014 | $2,341 | $82,865 | $6,480 | $76,385 |
Map
- 228 E Prospect St
- 232 E Prospect St
- 429 E Hanna St
- 1917 Avenue A
- 214 E Acheson St
- 110 E Florence St
- 721 E Bullock St
- 705 E Hanna St
- 625 E Murray St
- 120 Mark Dr
- 630 E Acheson St
- 515 E Murray St
- 625 E Acheson St
- 111 Doris Dr
- 500 E Heron St
- 512 E Heron St
- TBD E Heron St
- 516 E Heron St
- 14 Circle Dr
- 509 E Heron St
- 404 E Burrell St
- 412 E Burrell St
- 416 E Burrell St
- 400 E Burrell St
- 420 E Burrell St
- 1830 S Travis Ave
- 1826 S Travis Ave
- 1831 S Travis Ave
- 424 E Burrell St
- 1825 S Center St
- 1827 S Travis Ave
- 1830 S Center St
- 1818 S Travis Ave
- 1819 S Center St
- 1826 S Center St
- 1813 S Travis Ave
- 1812 S Travis Ave
- 1813 S Center St
- 1818 S Center St
- 1806 S Travis Ave
Ask me questions while you tour the home.