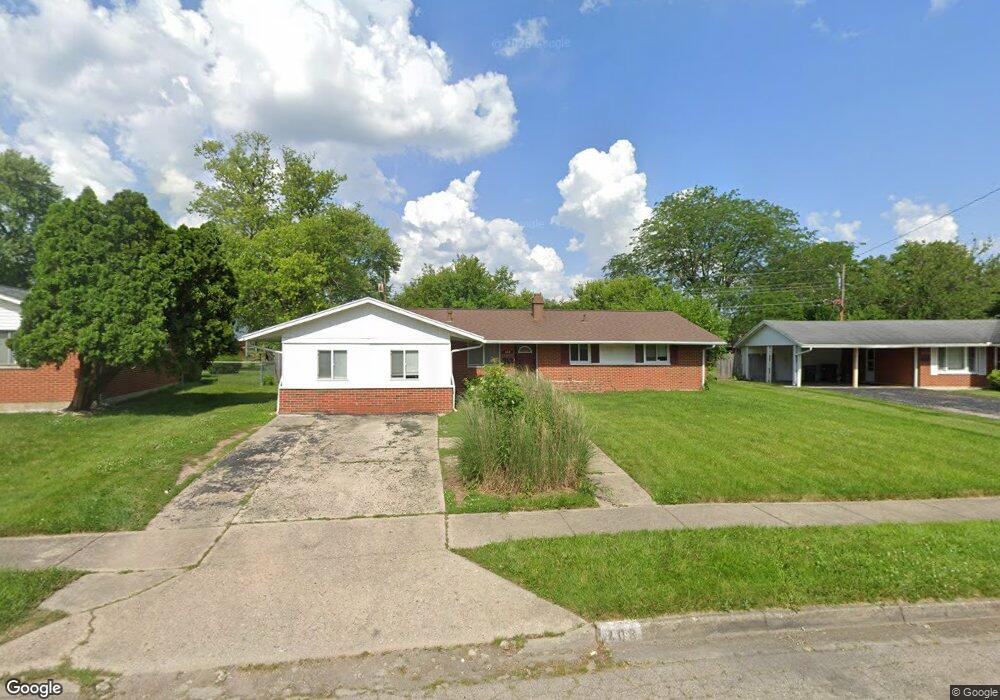
408 E Eppington Dr Dayton, OH 45426
Estimated Value: $175,173 - $193,000
3
Beds
2
Baths
1,778
Sq Ft
$103/Sq Ft
Est. Value
About This Home
This home is located at 408 E Eppington Dr, Dayton, OH 45426 and is currently estimated at $183,293, approximately $103 per square foot. 408 E Eppington Dr is a home located in Montgomery County with nearby schools including Trotwood-Madison Middle School, Trotwood-Madison High School, and Trotwood Preparatory & Fitness Academy.
Ownership History
Date
Name
Owned For
Owner Type
Purchase Details
Closed on
Jan 14, 2020
Sold by
Conrex Residential Prop Group 2016 Llc
Bought by
Conrex Res Prop Group 2016 03 Operating
Current Estimated Value
Home Financials for this Owner
Home Financials are based on the most recent Mortgage that was taken out on this home.
Original Mortgage
$152,000,000
Outstanding Balance
$133,779,634
Interest Rate
3.73%
Mortgage Type
Construction
Estimated Equity
-$133,596,341
Purchase Details
Closed on
Nov 22, 2019
Sold by
Green Brown Janine and Brown Janine
Bought by
Conrex Residential Prop Group 2016 Llc
Home Financials for this Owner
Home Financials are based on the most recent Mortgage that was taken out on this home.
Original Mortgage
$152,000,000
Outstanding Balance
$133,779,634
Interest Rate
3.73%
Mortgage Type
Construction
Estimated Equity
-$133,596,341
Purchase Details
Closed on
Apr 5, 2019
Sold by
Estate Of Clifford H Brown
Bought by
Brown Janine
Create a Home Valuation Report for This Property
The Home Valuation Report is an in-depth analysis detailing your home's value as well as a comparison with similar homes in the area
Home Values in the Area
Average Home Value in this Area
Purchase History
| Date | Buyer | Sale Price | Title Company |
|---|---|---|---|
| Conrex Res Prop Group 2016 03 Operating | $201,050 | None Available | |
| Conrex Residential Prop Group 2016 Llc | $61,500 | None Available | |
| Brown Janine | -- | None Available |
Source: Public Records
Mortgage History
| Date | Status | Borrower | Loan Amount |
|---|---|---|---|
| Open | Conrex Res Prop Group 2016 03 Operating | $152,000,000 |
Source: Public Records
Tax History
| Year | Tax Paid | Tax Assessment Tax Assessment Total Assessment is a certain percentage of the fair market value that is determined by local assessors to be the total taxable value of land and additions on the property. | Land | Improvement |
|---|---|---|---|---|
| 2025 | $2,605 | $38,260 | $6,010 | $32,250 |
| 2024 | $2,546 | $38,260 | $6,010 | $32,250 |
| 2023 | $2,546 | $38,260 | $6,010 | $32,250 |
| 2022 | $2,087 | $24,370 | $3,830 | $20,540 |
| 2021 | $2,090 | $24,370 | $3,830 | $20,540 |
| 2020 | $2,361 | $24,370 | $3,830 | $20,540 |
| 2019 | $2,103 | $21,970 | $3,830 | $18,140 |
| 2018 | $2,106 | $21,970 | $3,830 | $18,140 |
| 2017 | $2,093 | $21,970 | $3,830 | $18,140 |
| 2016 | $2,012 | $21,110 | $3,830 | $17,280 |
| 2015 | $1,980 | $21,110 | $3,830 | $17,280 |
| 2014 | $1,980 | $21,110 | $3,830 | $17,280 |
| 2012 | -- | $21,810 | $6,670 | $15,140 |
Source: Public Records
Map
Nearby Homes
- 717 Mapleside Dr
- 709 N Eppington Dr
- 708 Burman Ave
- 20 Macgregor Dr
- 417 Vaniman Ave
- 401 Stuckhardt Rd
- 808 Fairgrove Way
- 211 E Sunrise Ave
- 16 Hillgard St
- 4 Pleasant Ave
- 4825 Olive Rd
- 3312 Hazelpark Place
- 103 Oak St
- 4867 Northgate Ct
- 5719 Denlinger Rd
- 7540 Tuscola Dr
- 3845 Brumbaugh Blvd
- 512 N Sherry Dr
- 6440 Westanna Dr
- 0 Trotwood Blvd Unit 952242
- 404 E Eppington Dr
- 412 E Eppington Dr
- 3409 Olive Rd
- 3405 Olive Rd
- 3413 Olive Rd
- 901 Mineola Ct
- 409 E Eppington Dr
- 901 Macmillan Dr
- 905 Macmillan Dr
- 413 E Eppington Dr
- 405 E Eppington Dr
- 905 Mineola Ct
- 3417 Olive Rd
- 909 Macmillan Dr
- 401 E Eppington Dr
- 824 Mapleside Dr
- 3421 Olive Rd
- 917 Mineola Ct
- 909 Mineola Ct
- 829 Mapleside Dr
Your Personal Tour Guide
Ask me questions while you tour the home.