Estimated Value: $350,758 - $403,000
3
Beds
2
Baths
1,375
Sq Ft
$273/Sq Ft
Est. Value
About This Home
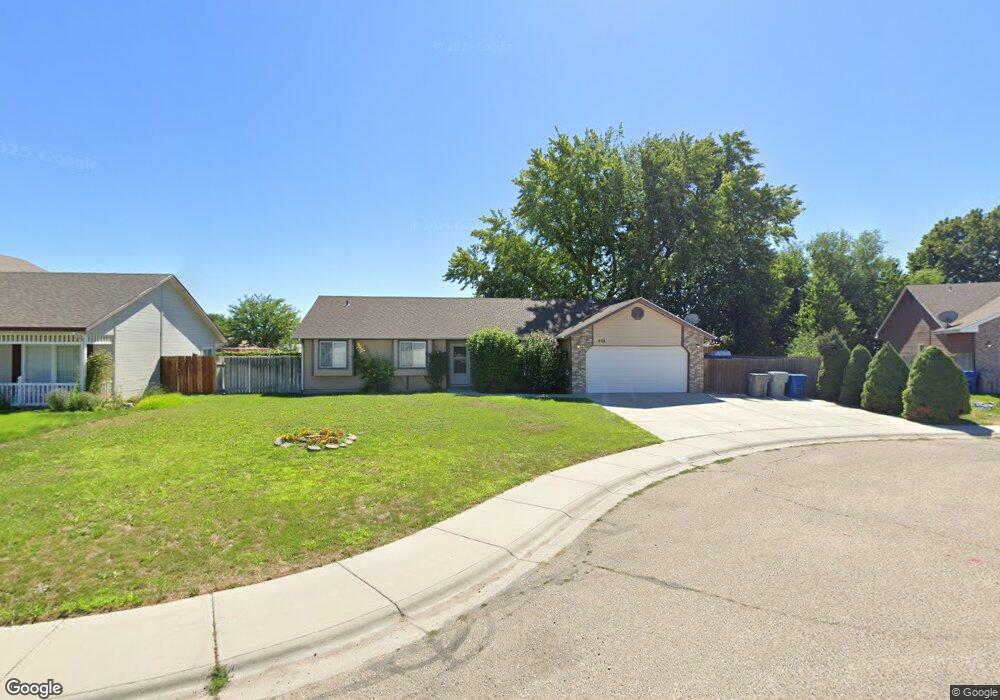
This home is located at 408 Fall Dr, Nampa, ID 83686 and is currently estimated at $375,690, approximately $273 per square foot. 408 Fall Dr is a home located in Canyon County with nearby schools including Iowa Elementary School, South Middle School, and Skyview High School.
Ownership History
Date
Name
Owned For
Owner Type
Purchase Details
Closed on
Aug 2, 2021
Sold by
Mejia Eucebia O
Bought by
Mejia Leticia Narda and Vargas Rosa A
Current Estimated Value
Purchase Details
Closed on
Jun 29, 2007
Sold by
Steckline James J and Steckline Wanda Lynn
Bought by
Mejia Eucebia O
Purchase Details
Closed on
Oct 20, 2005
Sold by
Macy Ramon D and Macy Jackie L
Bought by
Steckline James J and Steckline Wanda Lynn
Home Financials for this Owner
Home Financials are based on the most recent Mortgage that was taken out on this home.
Original Mortgage
$13,150
Interest Rate
5.67%
Mortgage Type
Stand Alone Second
Purchase Details
Closed on
May 13, 2004
Sold by
Chatham Joanne E
Bought by
Bryan Jackie L
Home Financials for this Owner
Home Financials are based on the most recent Mortgage that was taken out on this home.
Original Mortgage
$104,263
Interest Rate
5.5%
Mortgage Type
FHA
Create a Home Valuation Report for This Property
The Home Valuation Report is an in-depth analysis detailing your home's value as well as a comparison with similar homes in the area
Home Values in the Area
Average Home Value in this Area
Purchase History
| Date | Buyer | Sale Price | Title Company |
|---|---|---|---|
| Mejia Leticia Narda | -- | None Listed On Document | |
| Mejia Eucebia O | -- | Pioneer Title Company | |
| Steckline James J | -- | Stewart Title Nampa | |
| Bryan Jackie L | -- | Pioneer Title Company Of Can |
Source: Public Records
Mortgage History
| Date | Status | Borrower | Loan Amount |
|---|---|---|---|
| Previous Owner | Steckline James J | $13,150 | |
| Previous Owner | Steckline James J | $105,200 | |
| Previous Owner | Bryan Jackie L | $104,263 |
Source: Public Records
Tax History
| Year | Tax Paid | Tax Assessment Tax Assessment Total Assessment is a certain percentage of the fair market value that is determined by local assessors to be the total taxable value of land and additions on the property. | Land | Improvement |
|---|---|---|---|---|
| 2025 | $2,441 | $346,200 | $98,700 | $247,500 |
| 2024 | $2,441 | $341,200 | $98,700 | $242,500 |
| 2023 | $2,520 | $334,500 | $98,700 | $235,800 |
| 2022 | $2,660 | $360,400 | $111,000 | $249,400 |
| 2021 | $3,017 | $256,100 | $55,500 | $200,600 |
| 2020 | $2,743 | $211,800 | $43,000 | $168,800 |
| 2019 | $3,020 | $188,200 | $37,000 | $151,200 |
| 2018 | $2,976 | $0 | $0 | $0 |
| 2017 | $2,753 | $0 | $0 | $0 |
| 2016 | $2,469 | $0 | $0 | $0 |
| 2015 | $2,106 | $0 | $0 | $0 |
| 2014 | $2,019 | $103,600 | $21,000 | $82,600 |
Source: Public Records
Map
Nearby Homes
- 417 S Valley Dr
- 435 Bitterbrush Ave
- 535 Seasons Ct
- 8094 W Maryland Ave
- 502 Crosspoint Ave
- 514 Crosspoint Ave
- 2613 S Canyon St
- 710 W Wildrye Ct
- 622 W Highland Ave
- 538 Morning Sun Dr
- 1621 S Woodland Dr
- 1417 Lois Ln
- 2813 S Bayhill Ct
- 1904 Tyler St
- 2619 S Sienna Dr
- 435 E Elaine Ct
- 438 E Elaine Ct
- 517 Pennsylvania Ct
- 442 E Elaine Ct
- 525 E Greenhurst Rd
Your Personal Tour Guide
Ask me questions while you tour the home.