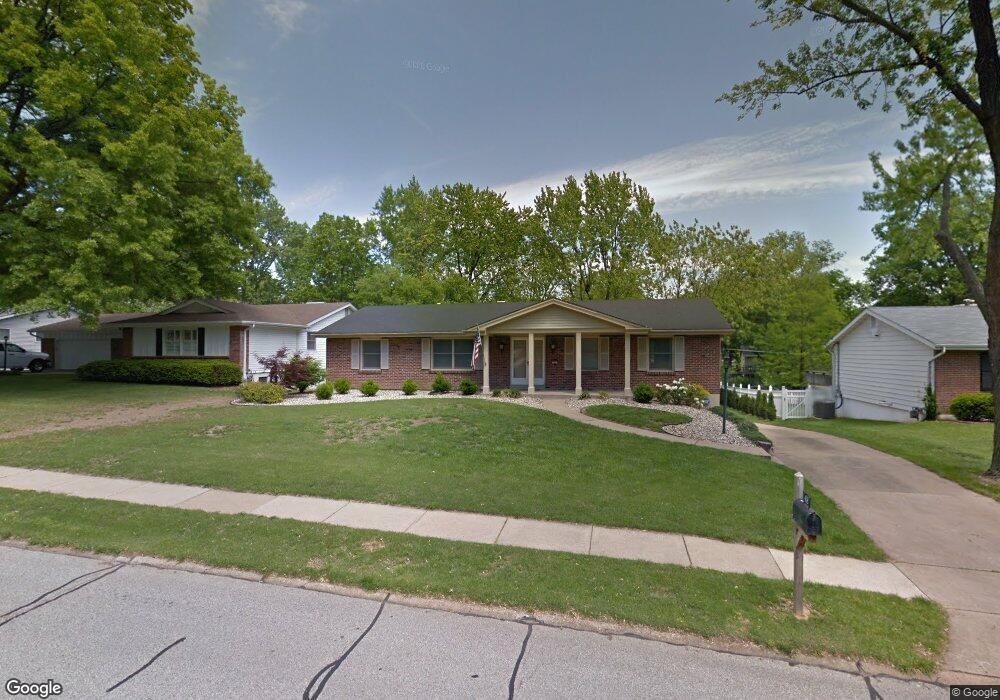
408 Hill Trail Ballwin, MO 63011
Estimated Value: $350,382 - $400,000
3
Beds
2
Baths
1,800
Sq Ft
$214/Sq Ft
Est. Value
About This Home
This home is located at 408 Hill Trail, Ballwin, MO 63011 and is currently estimated at $385,346, approximately $214 per square foot. 408 Hill Trail is a home located in St. Louis County with nearby schools including Henry Elementary School, Parkway West Middle School, and Parkway West High School.
Ownership History
Date
Name
Owned For
Owner Type
Purchase Details
Closed on
Jun 13, 2002
Sold by
Bank Of America Na
Bought by
Sheahan John J and Sheahan Dorothy J
Current Estimated Value
Home Financials for this Owner
Home Financials are based on the most recent Mortgage that was taken out on this home.
Original Mortgage
$154,186
Outstanding Balance
$65,009
Interest Rate
6.77%
Estimated Equity
$320,337
Purchase Details
Closed on
May 15, 2002
Sold by
Patterson Michael E
Bought by
Dark Christopher
Home Financials for this Owner
Home Financials are based on the most recent Mortgage that was taken out on this home.
Original Mortgage
$154,186
Outstanding Balance
$65,009
Interest Rate
6.77%
Estimated Equity
$320,337
Purchase Details
Closed on
Dec 27, 2000
Sold by
Wei William George and Weir Patricia Marianne Fulghum
Bought by
Patterson Michael E
Home Financials for this Owner
Home Financials are based on the most recent Mortgage that was taken out on this home.
Original Mortgage
$157,000
Interest Rate
7.73%
Create a Home Valuation Report for This Property
The Home Valuation Report is an in-depth analysis detailing your home's value as well as a comparison with similar homes in the area
Home Values in the Area
Average Home Value in this Area
Purchase History
| Date | Buyer | Sale Price | Title Company |
|---|---|---|---|
| Sheahan John J | -- | -- | |
| Dark Christopher | $182,500 | -- | |
| Patterson Michael E | $172,000 | -- | |
| Patterson Michael E | -- | -- |
Source: Public Records
Mortgage History
| Date | Status | Borrower | Loan Amount |
|---|---|---|---|
| Open | Sheahan John J | $154,186 | |
| Closed | Dark Christopher | $173,350 | |
| Previous Owner | Patterson Michael E | $157,000 |
Source: Public Records
Tax History
| Year | Tax Paid | Tax Assessment Tax Assessment Total Assessment is a certain percentage of the fair market value that is determined by local assessors to be the total taxable value of land and additions on the property. | Land | Improvement |
|---|---|---|---|---|
| 2025 | $3,504 | $63,650 | $28,690 | $34,960 |
| 2024 | $3,504 | $54,000 | $17,230 | $36,770 |
| 2023 | $3,455 | $54,000 | $17,230 | $36,770 |
| 2022 | $3,375 | $47,950 | $19,130 | $28,820 |
| 2021 | $3,355 | $47,950 | $19,130 | $28,820 |
| 2020 | $3,345 | $45,300 | $19,080 | $26,220 |
| 2019 | $3,307 | $45,300 | $19,080 | $26,220 |
| 2018 | $3,431 | $43,610 | $17,180 | $26,430 |
| 2016 | $3,326 | $41,410 | $12,430 | $28,980 |
Source: Public Records
Map
Nearby Homes
- 351 Champion Way Dr
- 103 Calico Ln
- 277 Oak Path Dr
- 323 Oakleigh Woods Dr
- 9 Chesterton Ln
- 421 Andover Ln
- 117 Old Oaks Dr
- 102 Five Meadows Ln
- 426 Brooktree Dr
- 500 Kingridge Dr
- 2455 Clayborn Dr Unit 2455
- 14685 Clayton Rd
- 502 Iron Lantern Dr
- 15066 Green Circle Dr
- 14991 Broadmont Dr
- 406 Forsheer Dr
- 114 Lea Meadows Dr
- 27 Chesterton Ln
- 14511 Wellington Estates Manor
- 323 Chipley Cir
- 404 Hill Trail
- 412 Hill Trail
- 156 Wild Oak Ct
- 400 Hill Trail
- 416 Hill Trail
- 158 Wild Oak Ct
- 154 Wild Oak Ct
- 403 Hill Trail
- 401 Hill Trail Dr
- 401 Hill Trail
- 160 Wild Oak Ct
- 329 Hill Trail
- 420 Hill Trail
- 328 Hill Trail
- 152 Wild Oak Ct
- 162 Wild Oak Ct
- 327 Hill Trail
- 421 Trail Grove Ct
- 407 Trail Grove Ct
- 422 Hill Trail
Your Personal Tour Guide
Ask me questions while you tour the home.